Introduction
This set of charts uses the City of Toronto’s open data on Private Transportation Companies (PTCs) to follow monthly trends in the Greater Toronto Area ridehail market.
Active Driver Numbers
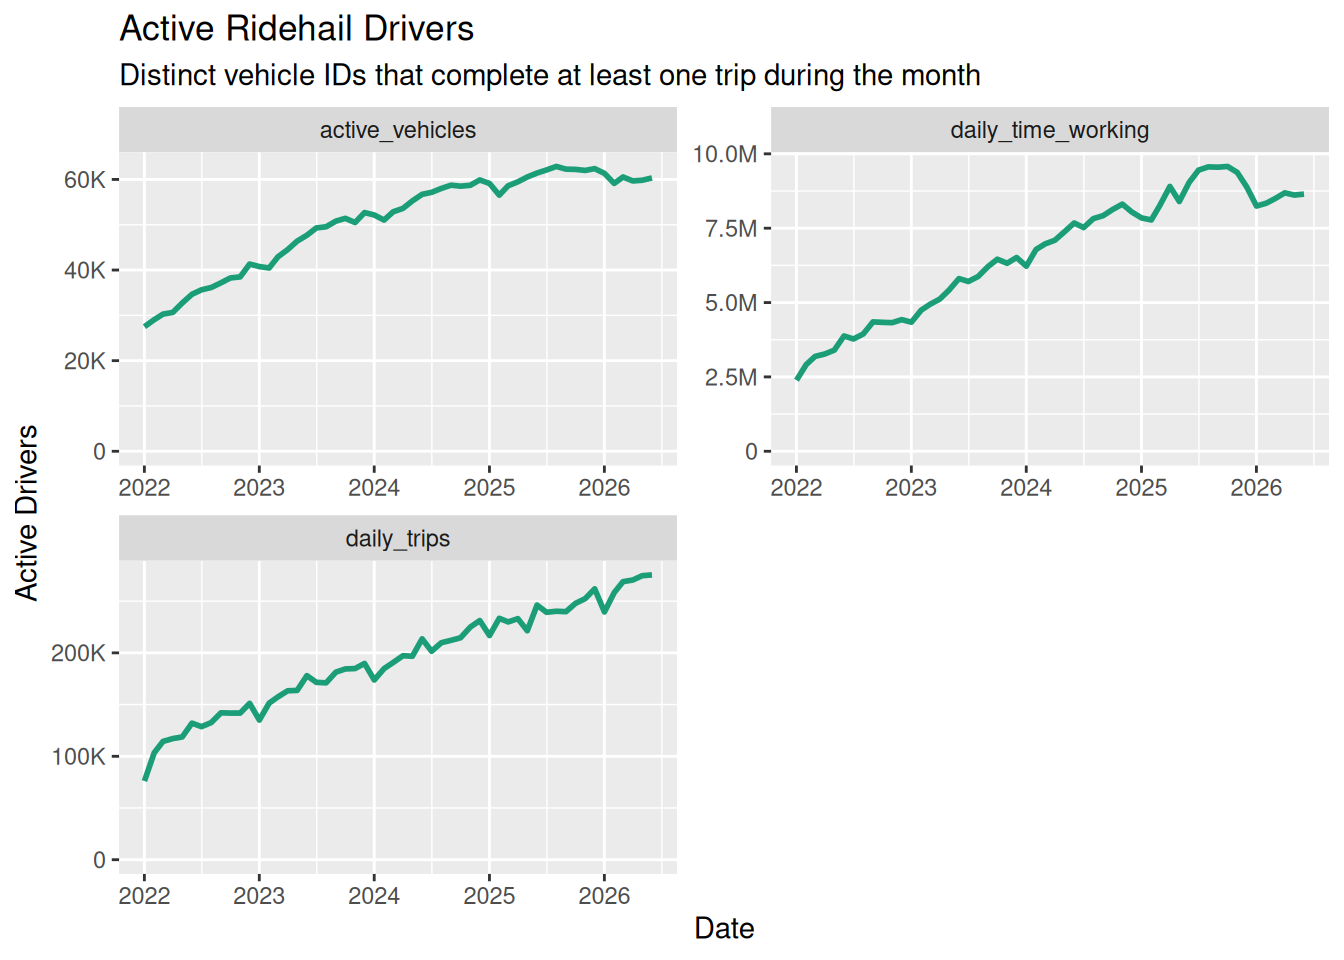
Strictly speaking, the data set tracks vehicles, but we assume here that one vehicle equals one driver. Figure 1 shows that the number of drivers was also steadily increasing until 2025. The data set does not distinguish among PTCs (Uber, Lyft) but does disaggregate vehicles, so that a driver on both platforms is not counted twice.
Driver activity
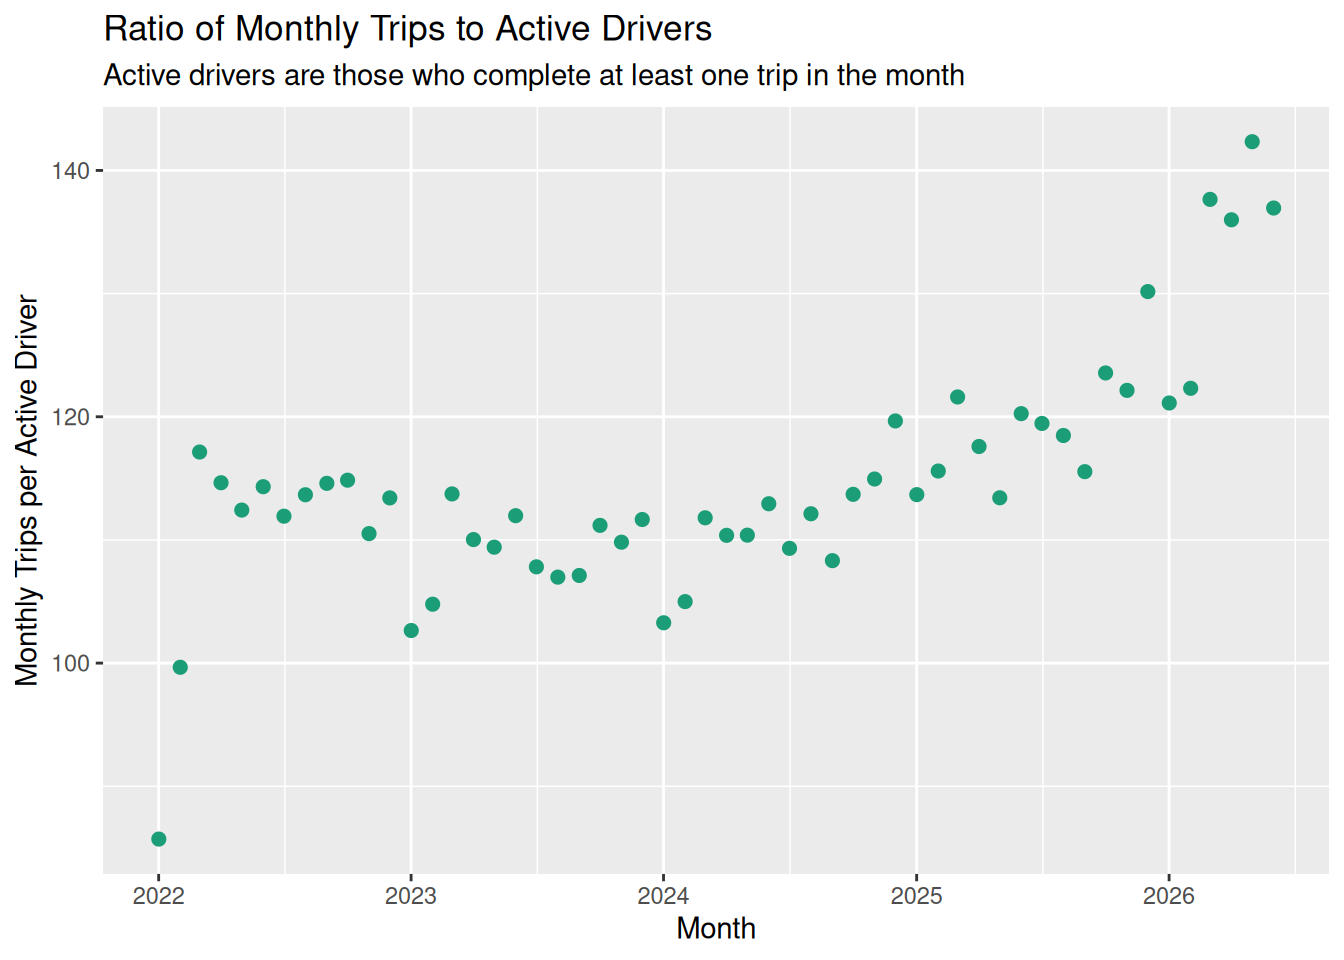
Figure 2 shows the long-term trends, as a ratio of daily trips per driver.
Driver Turnover
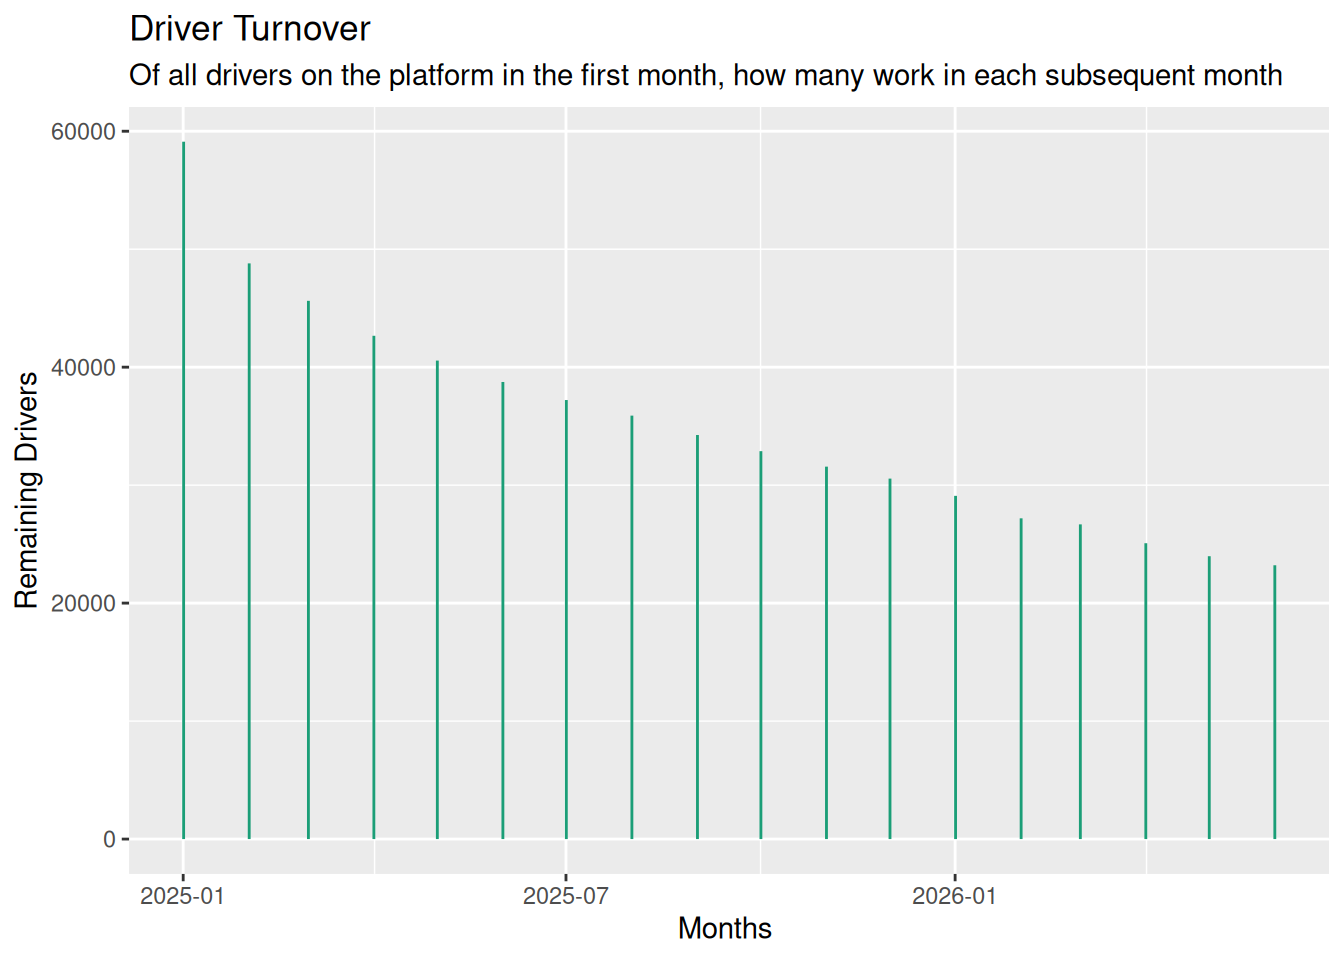
Figure 3 shows that about half of all drivers leave within a year of starting work. Some small percentage of the changes may be drivers changing vehicles, but we judge this to be a small effect.
The cohort is the drivers who took at least one trip in January 2025, and each later month counts how many of them were still taking trips, so the same “active driver” criterion applies at both ends.
Utilization: trends
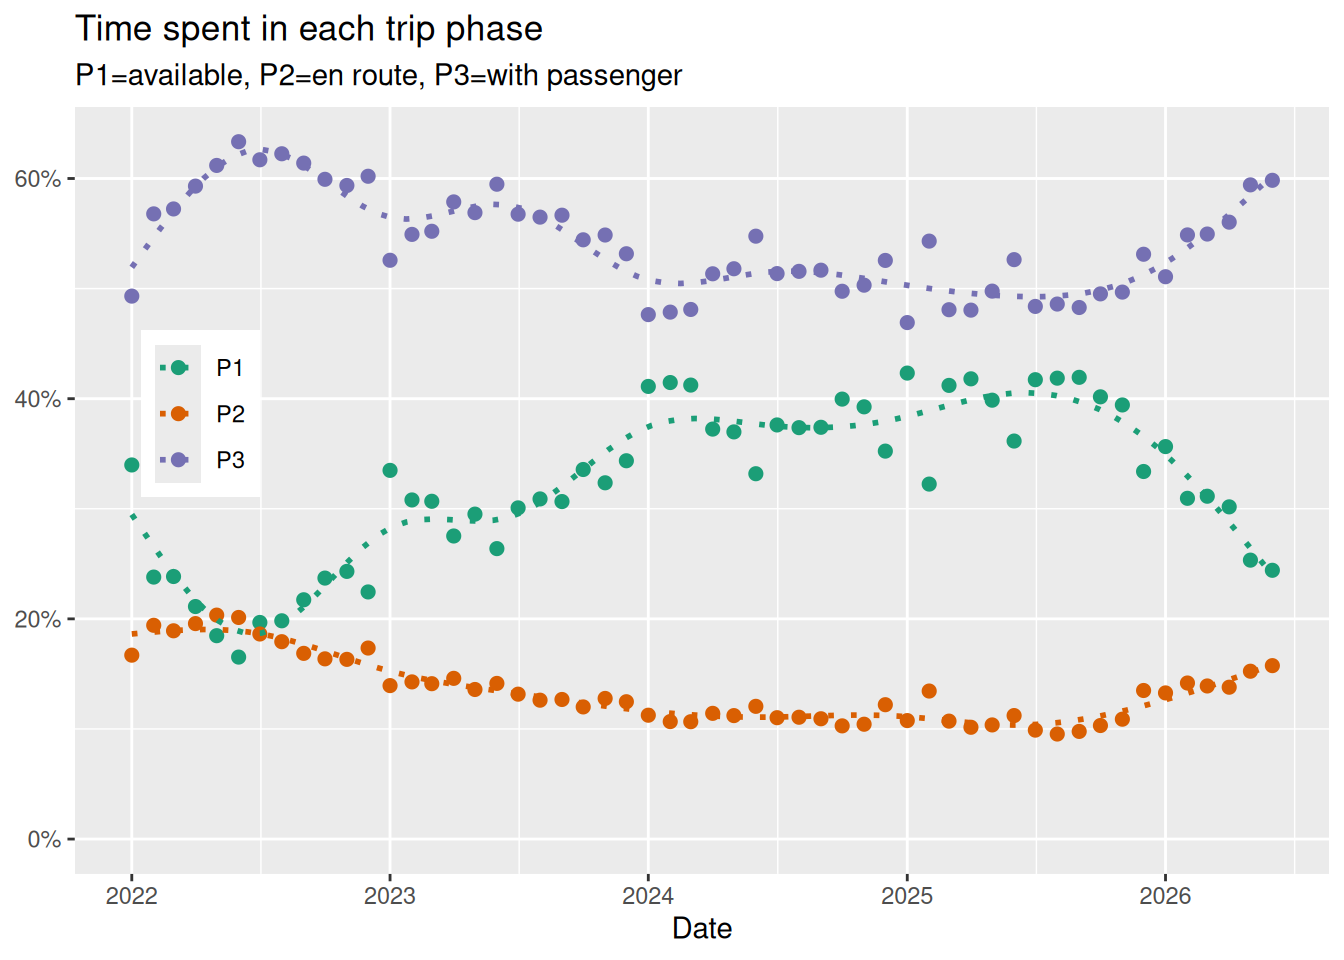
We would expect utilization rates to follow supply and demand. The key observation from Figure 4 is that utilization rates (that is, the percent of time that drivers are carrying passengers and being paid) fell from 60% in 2022 to 50% in 2025: an effective pay cut of 16%. So far in 2026 they have recovered to about 56%, which is the first sustained improvement in four years.
Utilization and Supply/Demand
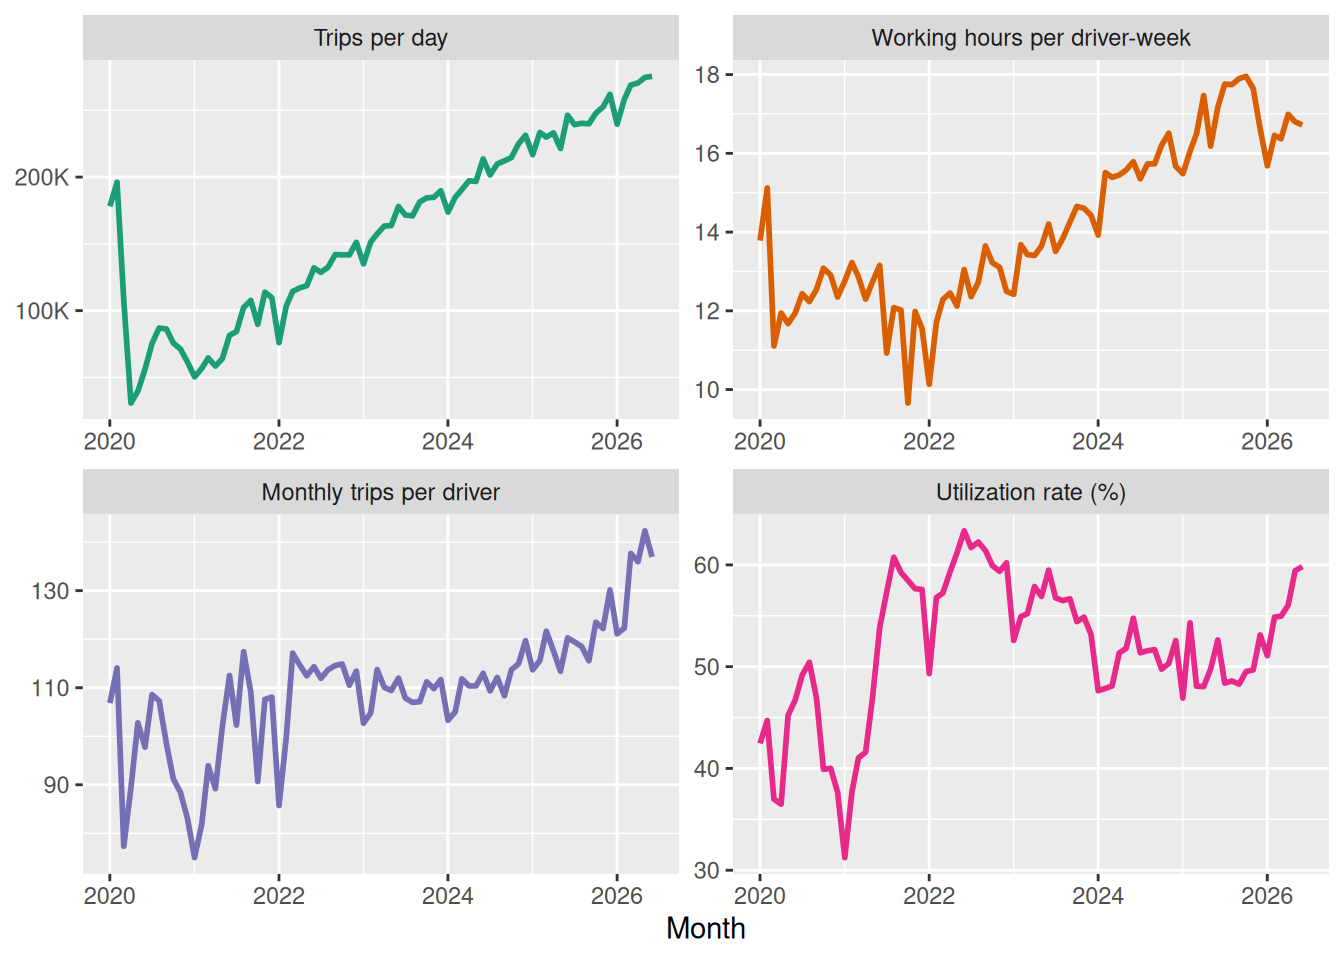
Previous plots seem to show a contradiction: a falling utilization rate on one hand, but also a rising ratio of trips to drivers. These two should go in the same direction but the plots suggest (with noise) that they are going in opposite directions.
Figure 5 provides an explanation. The average number of working hours per week for a driver has increased from about 10 in 2022 by over a third, to almost 14 hours per week in 2025. Even though there are more trips per driver, each driver is on the road for longer, so the utilization rate has not improved.
Utilization: hour of the day
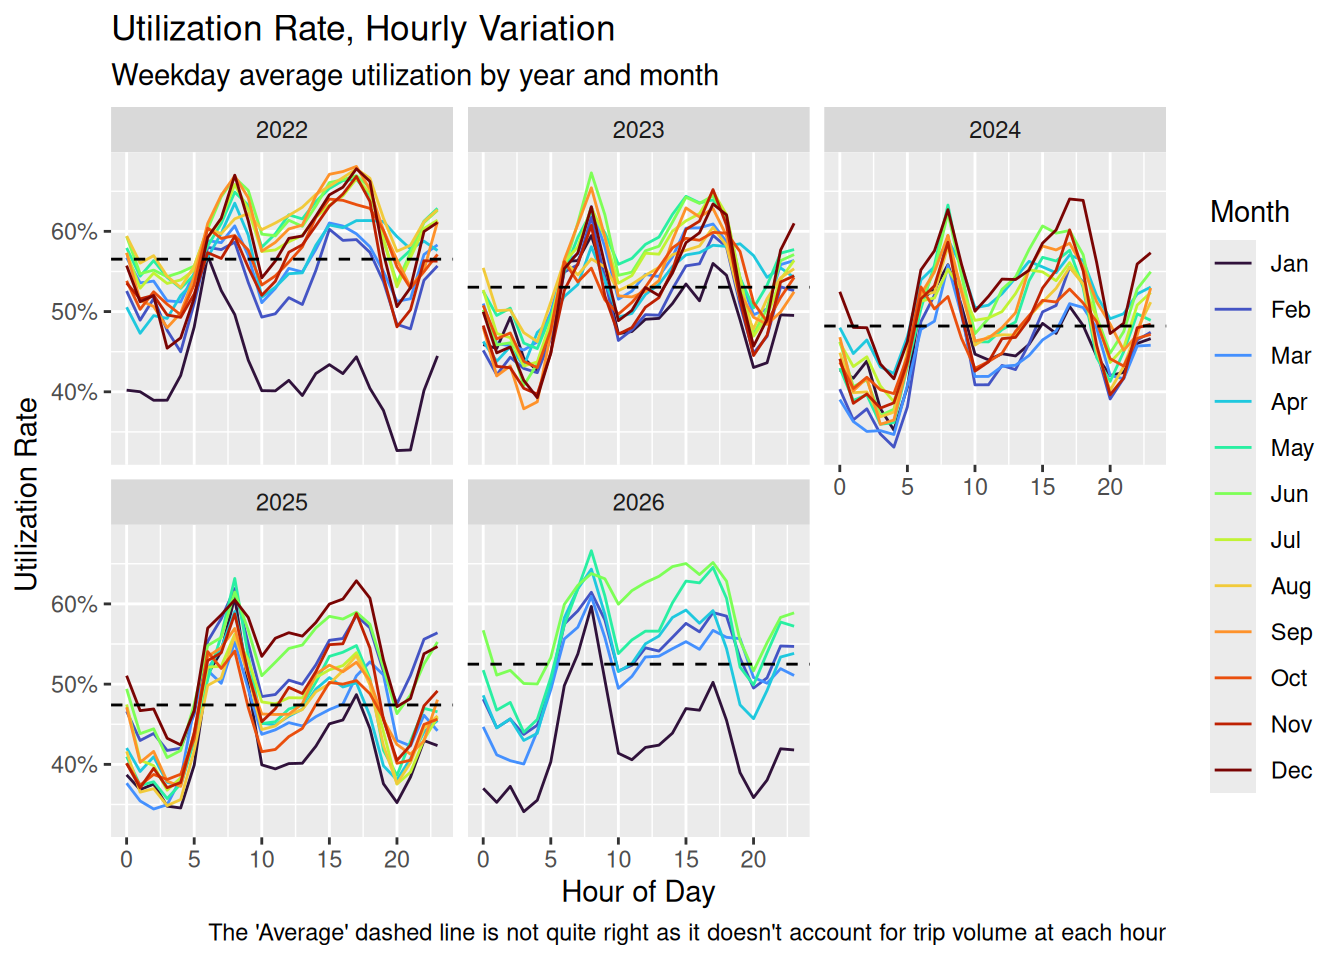
Figure 6 shows how utilization rates change over the course of a day. Utilization is high around morning and afternoon rush hours, but full-time drivers must also be on the road at low-utilization times to make a living. There is no sign of improvements to the low utilization rates.
Utilization: driver hours
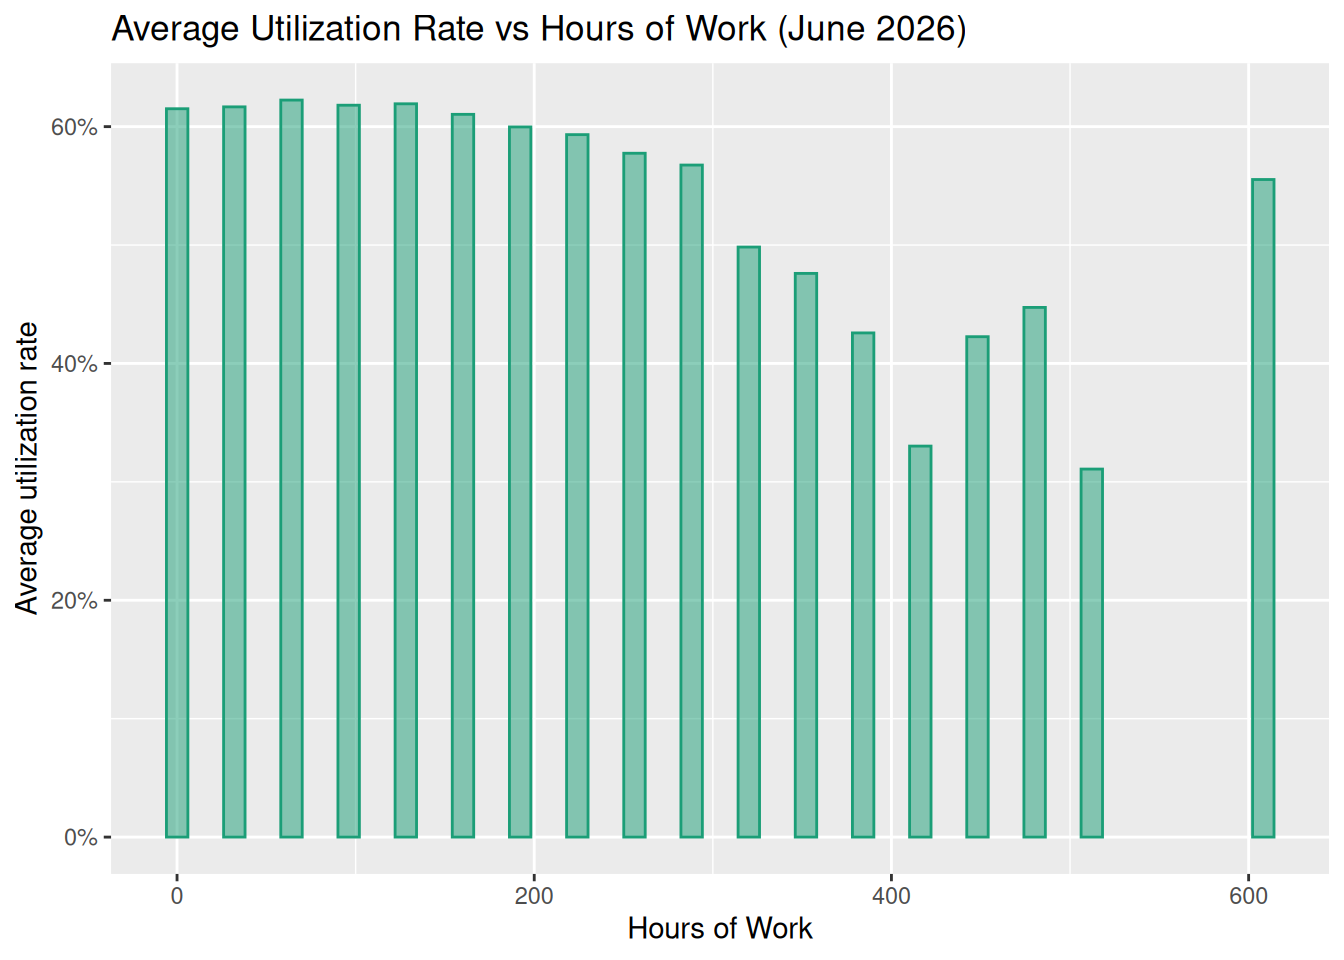
Caveat: the utilization rates for drivers who put in long hours (say over 200 hours per month) show a lot of variation because of the small numbers of drivers involved.