| Metric | Value | vs last month | vs a year ago |
|---|---|---|---|
| Average trips per day | 242,415 | -0.2% | -7.9% |
| Active drivers | 59,948 | +1.2% | -5.6% |
| Drivers full time (>= 240 trips) | 16.7% | -0.6 pp | -0.8 pp |
| Trips by full-time drivers | 48.8% | -1.1 pp | -1.9 pp |
| Driver starts | 7,946 | -5.3% | -14.5% |
| Driver quits | 7,839 | -5.3% | -11.2% |
Introduction
This set of charts uses the City of Chicago’s open data to explore trends in the Chicago ridehail system.
To make the analysis more tractable, it works from a sample of trips rather than the full set: a 1-in-16 random sample (every trip whose ID begins with a given hex digit) for each month. For information about the data sets, see Dashboards home page.
Thanks to the Chicago data portal team for helpful answers to questions, and for a suggestion that improved sampling from the Trips data set.
This month at a glance
Table 1 lists headline numbers for August 2026, together with comparisons to last month and to a year earlier.
Of the 63,505 drivers active in August 2025, an estimated 55.6% are inactive in August 2026.
Trip volume
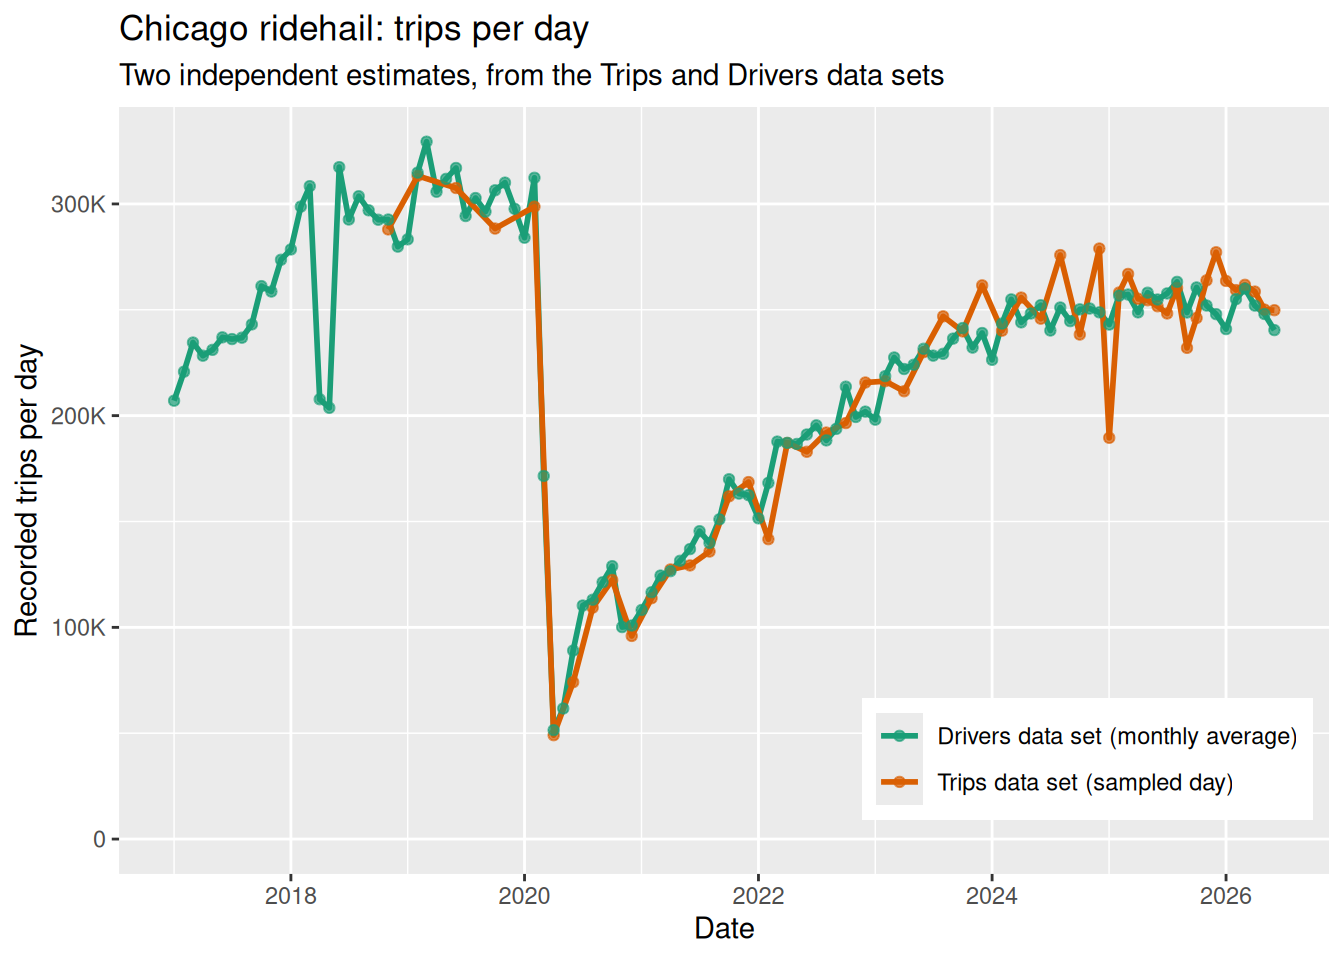
Figure 1 shows two calculations of daily ridehail trips in Chicago: one calculated from the sampled Trips data set, and one calculated from the Drivers data set (total monthly trips divided by days in the month).
For reference: 250,000 trips per day is equivalent to just over 10,000 per hour, or about 175 per minute.
Active drivers
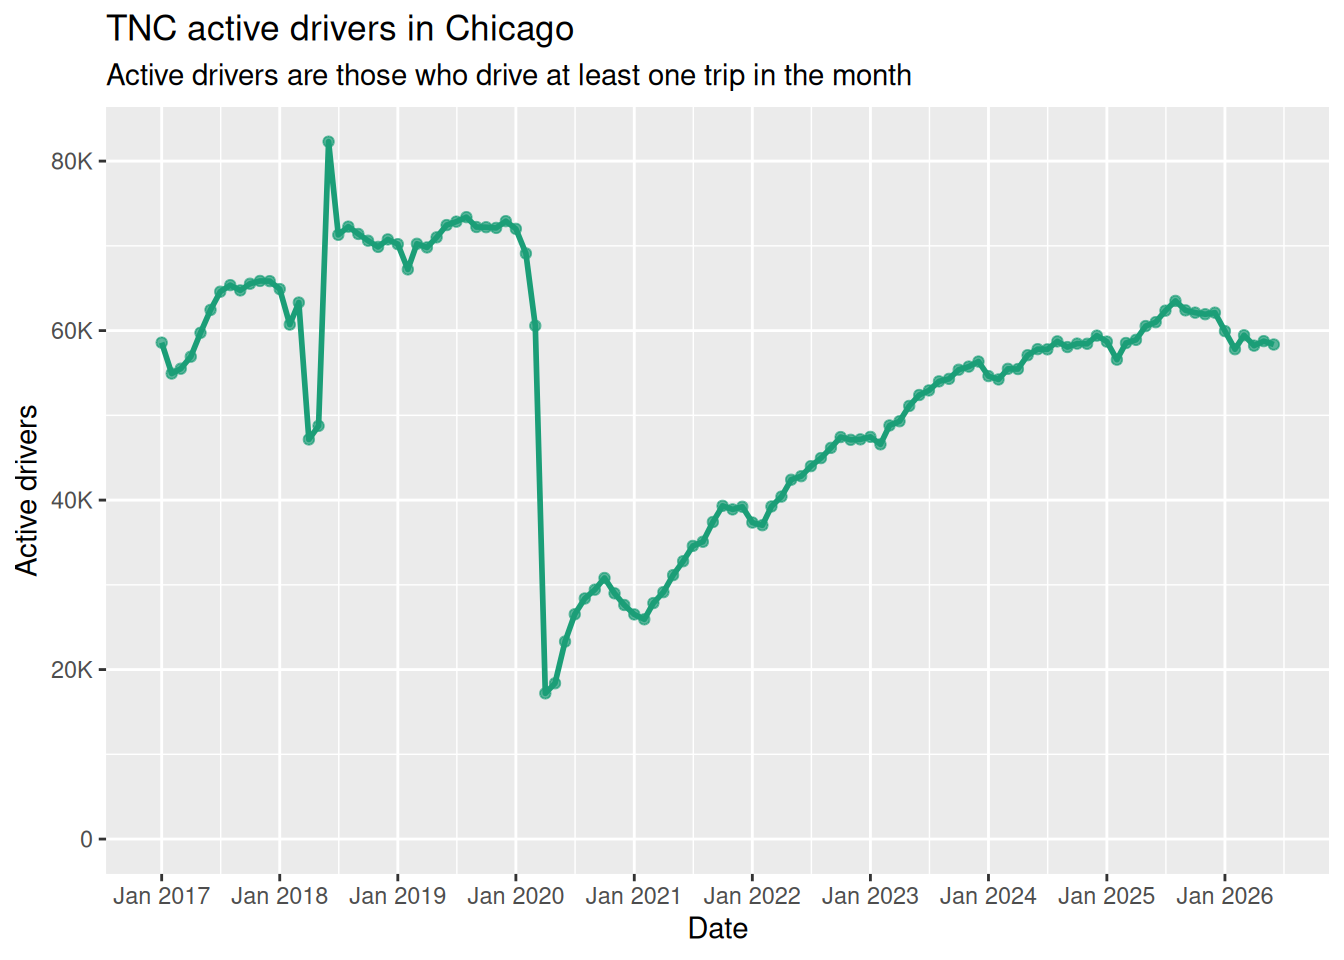
Figure 2 shows the total number of active drivers each month (drivers who have driven at least one trip).
Regarding the outliers in Q2 2018, there is a note on the City of Chicago web site:
[S]ome vehicle records for Q2 2018 (April-June) were reported for the quarter as a whole, rather than for individual months. For purposes of this dataset, those records have been assigned to 2018-06 (June). Therefore, some caution in interpreting this month and the quarter as a whole is advised.
Total fares
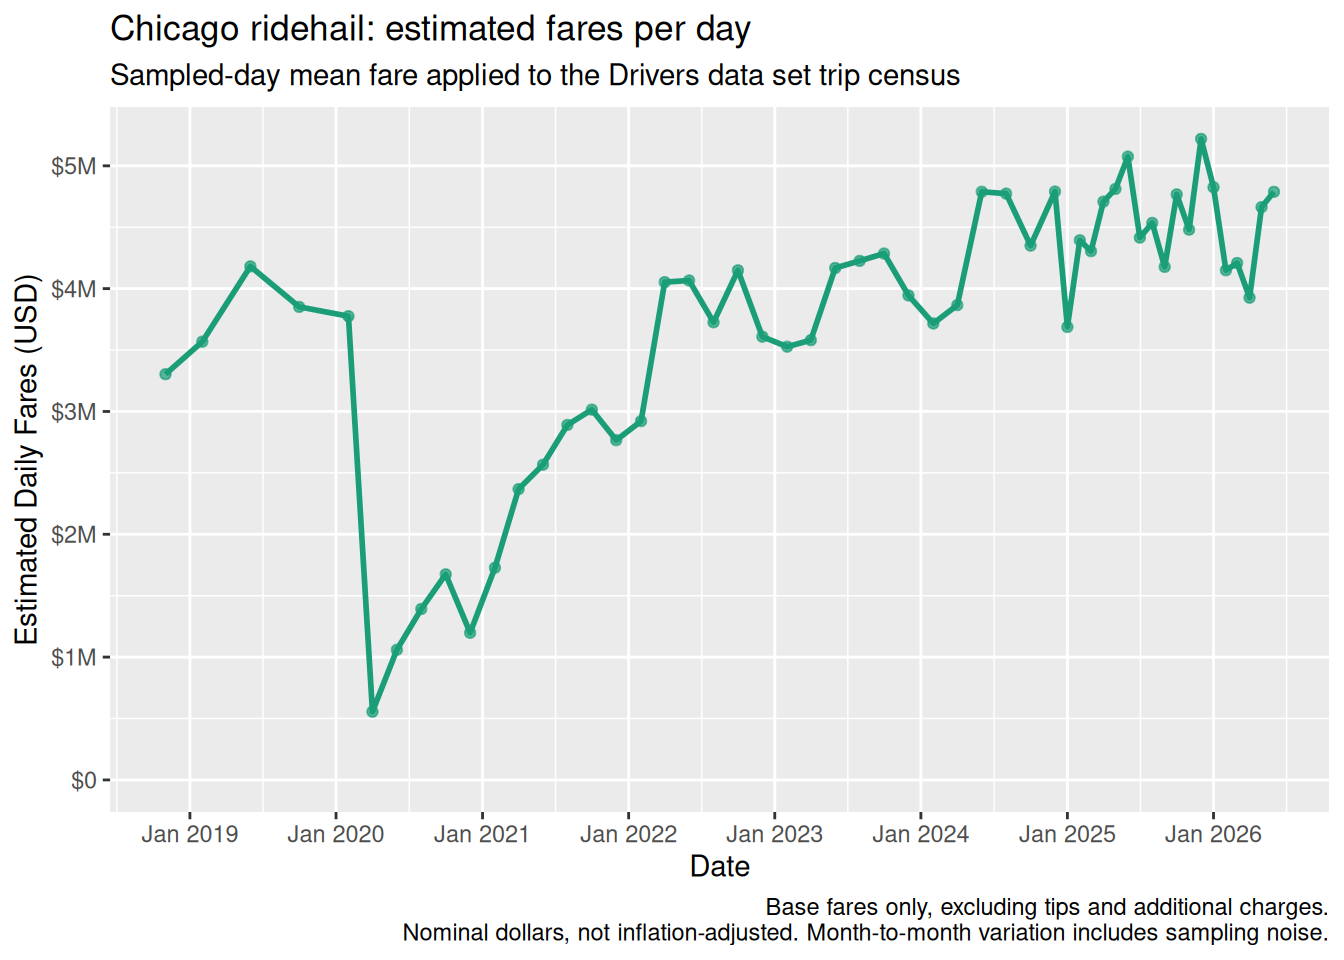
Figure 3 shows an estimate of the total fares paid by ridehail passengers (excluding tips), with and without “additional charges”. The estimate is obtained by calculating the mean fare over the month’s sampled trips, and then using the Drivers data set to scale that to a monthly total.
The series begins at the earliest month of the trip sample, and lengthens as collection works backwards; per-trip fare reporting itself began in November 2018.
Trip characteristics
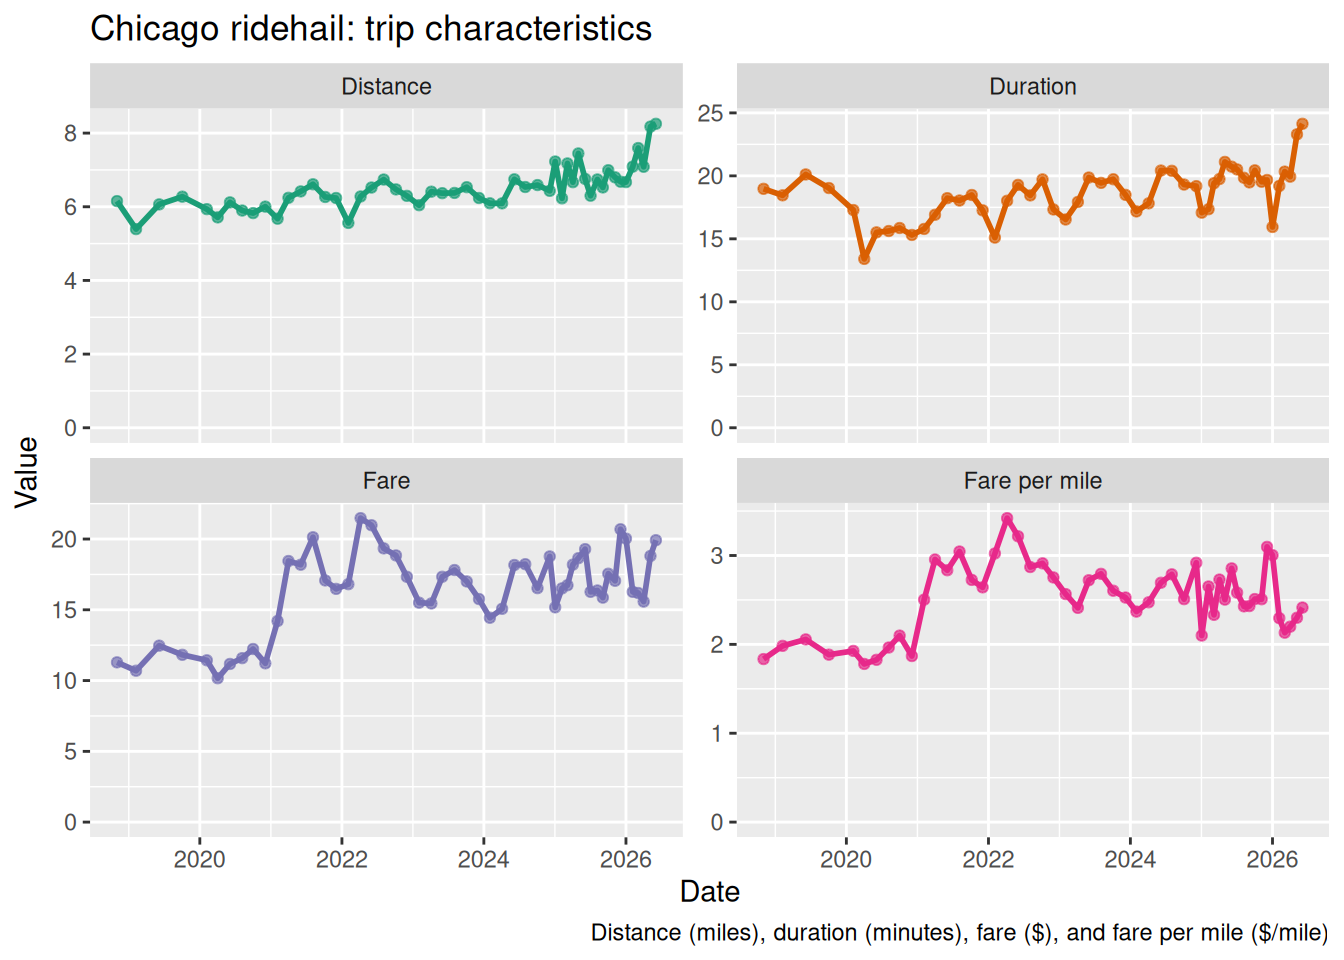
Figure 4 shows how average trip distance, duration, fare, and fare per mile have changed over time, calculated from the Trips data set sample.
Supply and demand
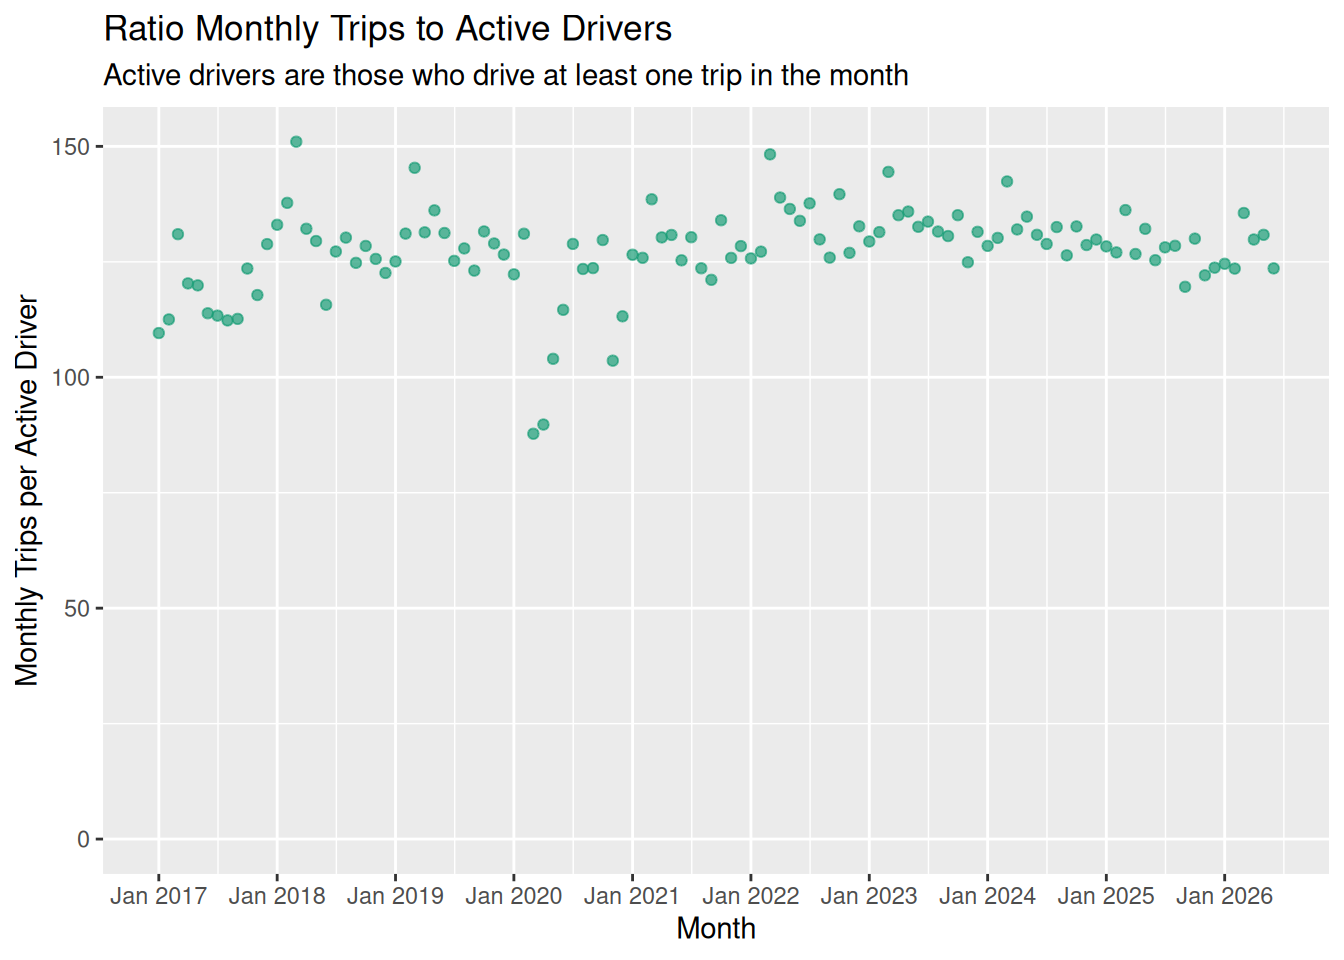
Figure 5 shows the long-term trend of supply (active drivers) and demand (trips), as a ratio of monthly trips per active driver.
Supply and demand: hour of the day
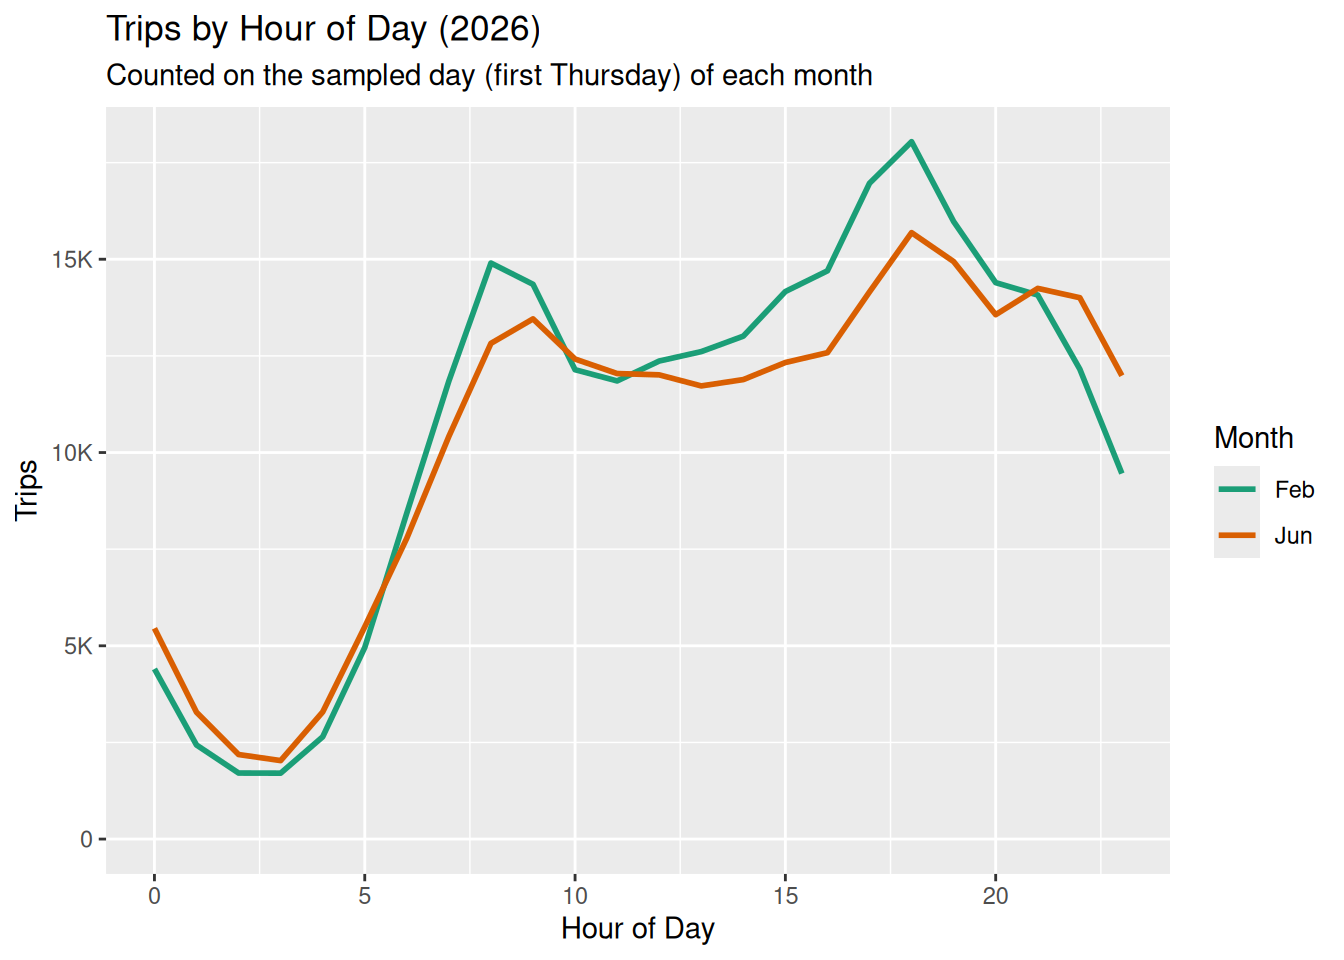
Figure 6 shows how demand varies over the course of the day, for two months of the current year.
The corresponding chart for Toronto shows the supply of drivers by hour of day as well: this data is not available for Chicago.
Cancellations
The Chicago Trips data set records only completed trips: a request that the passenger or the driver cancels never appears. There is therefore no Chicago equivalent of the Toronto cancellation charts, which are built from the cancellation counts the City of Toronto publishes for each vehicle-hour.
Fleet efficiency
Figure 7 ranks every active driver by the number of trips they completed in the month, from most to least, and traces the cumulative share of all trips that they account for.
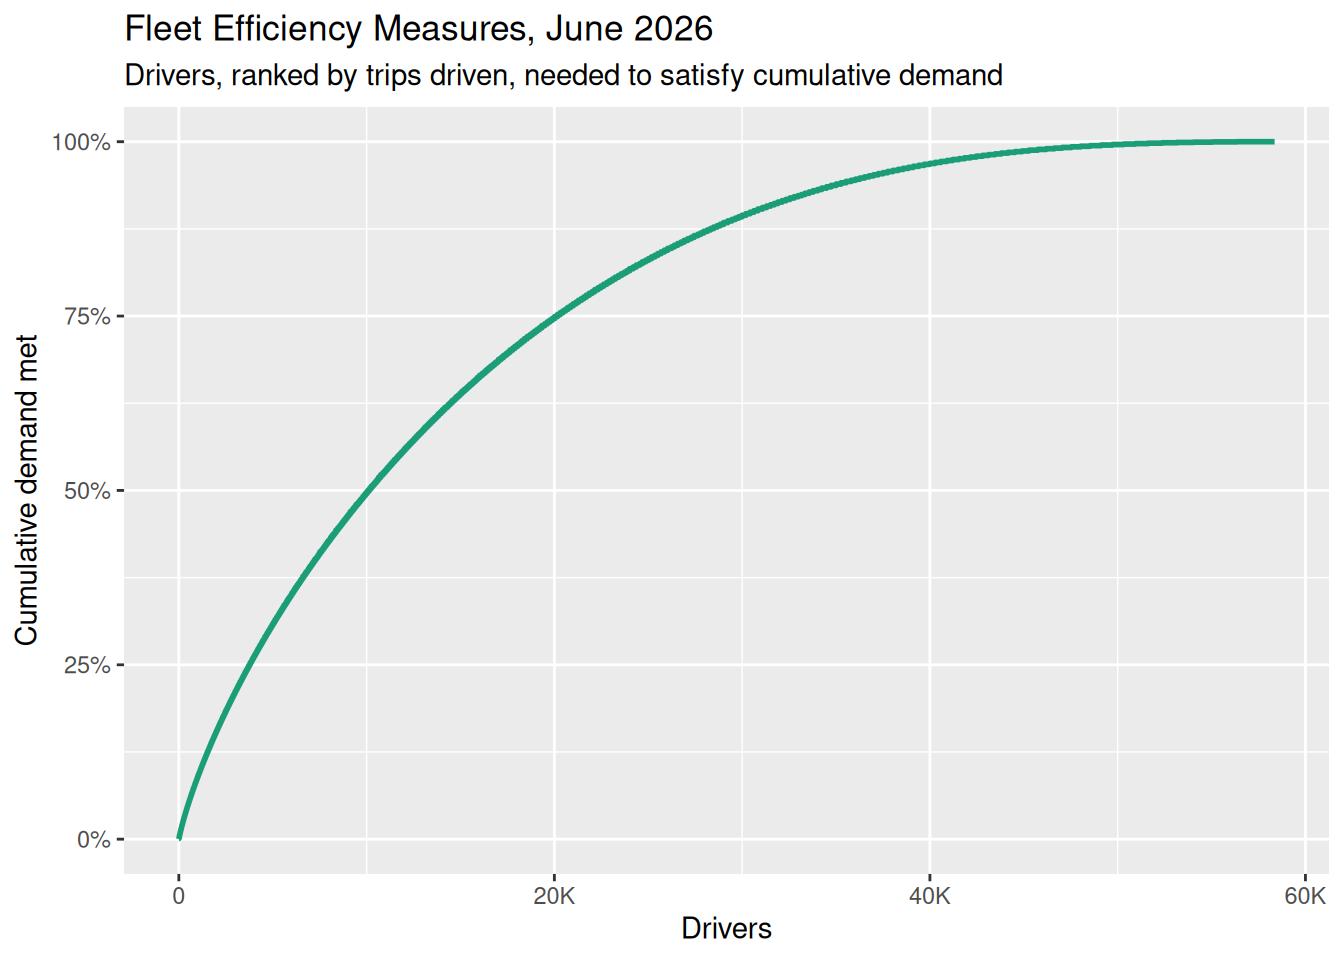
The busiest third of drivers accounted for 74% of all trips in August 2026.
Fares
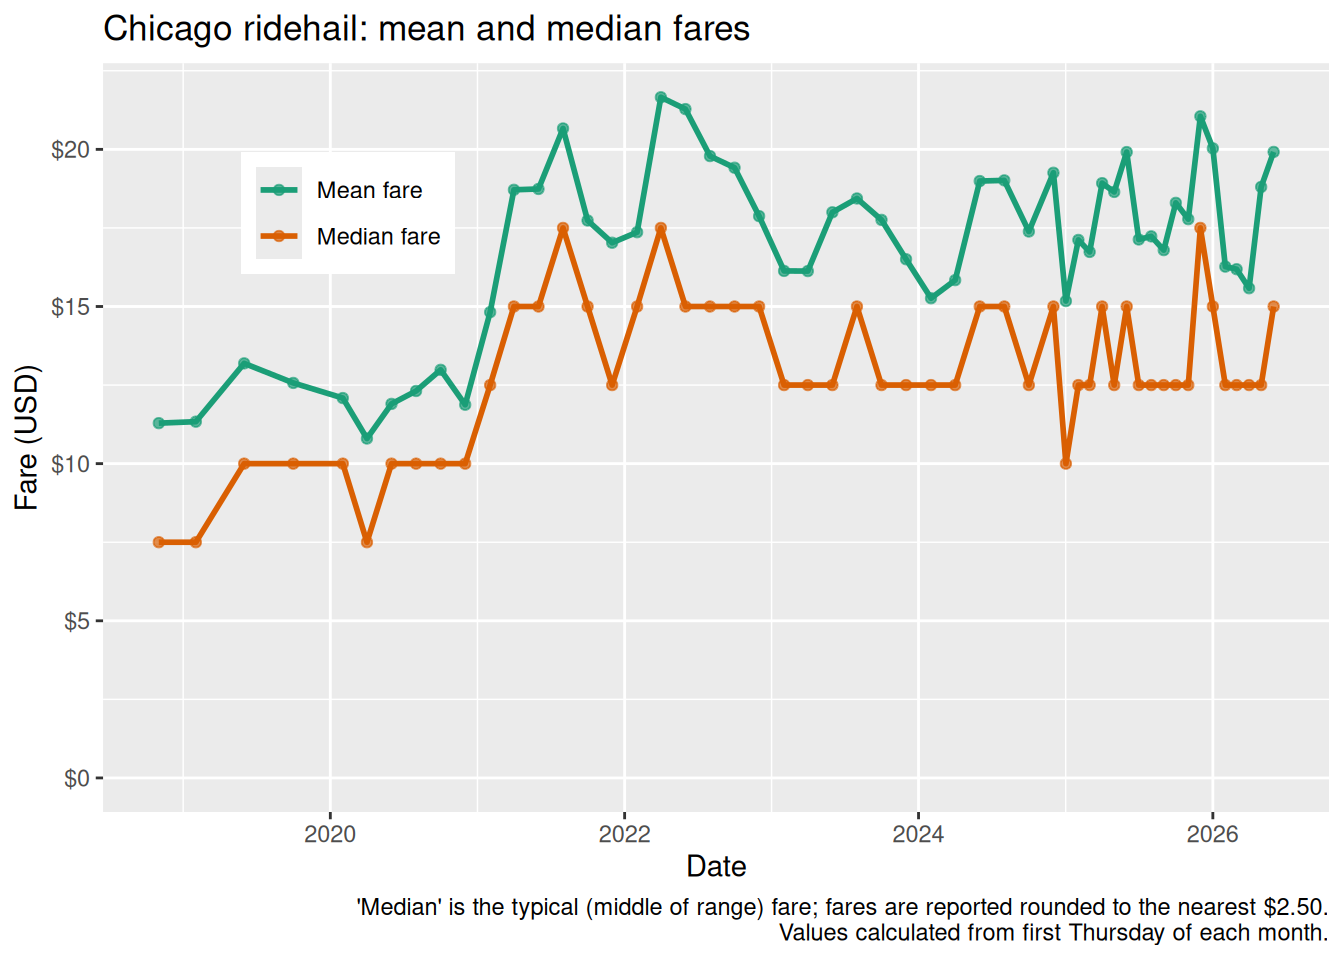
Figure 8 shows the mean and median passenger fare in each month, calculated from the month’s individual sampled trips. The City rounds each fare to the nearest $2.50, which is why the median moves in steps rather than smoothly.
Fare distribution
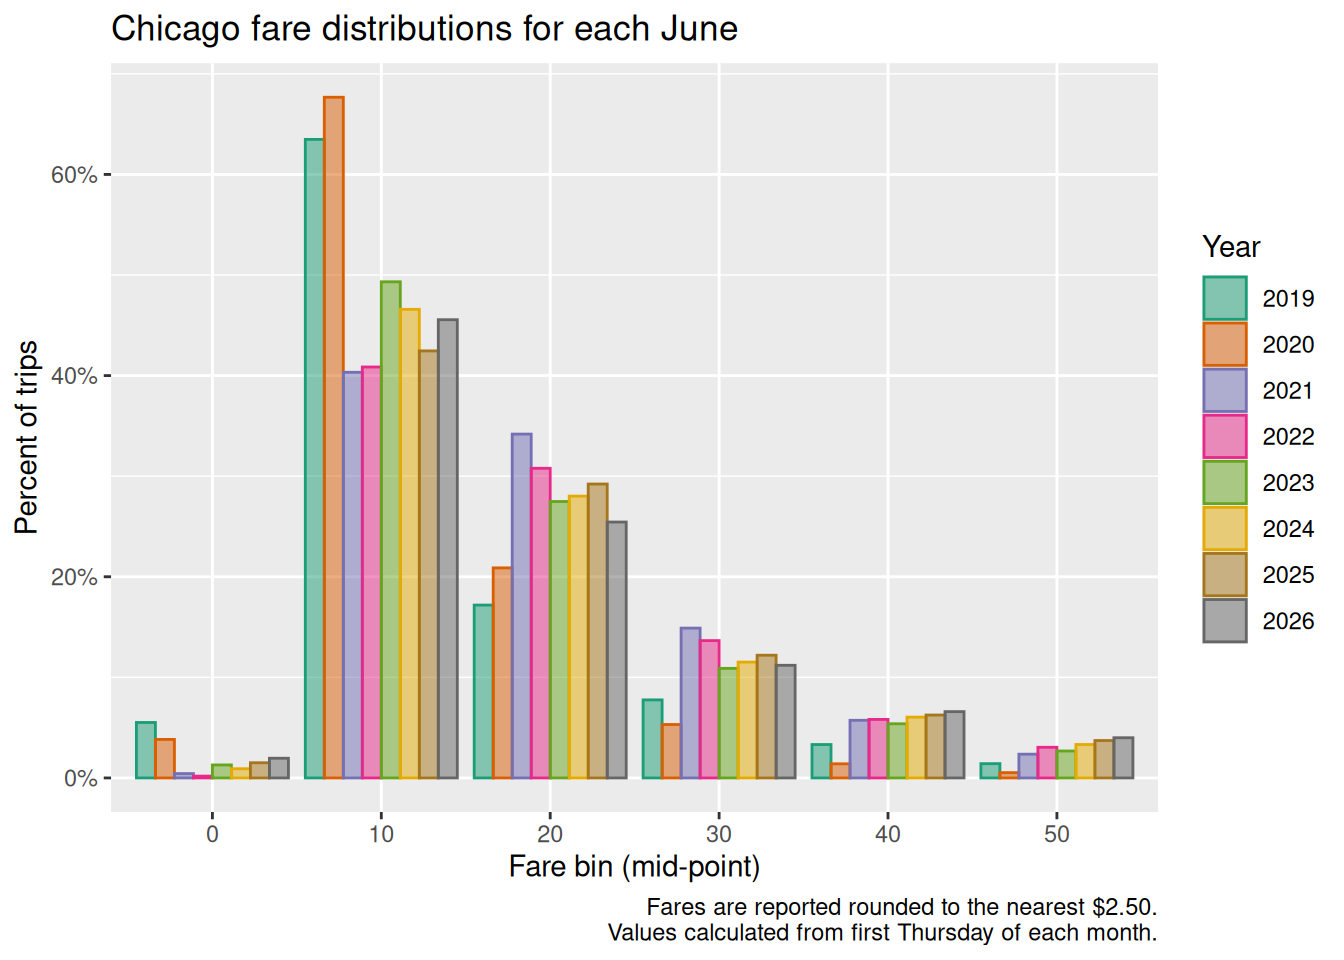
Figure 9 compares the shape of the fare distribution in the same month of each year.
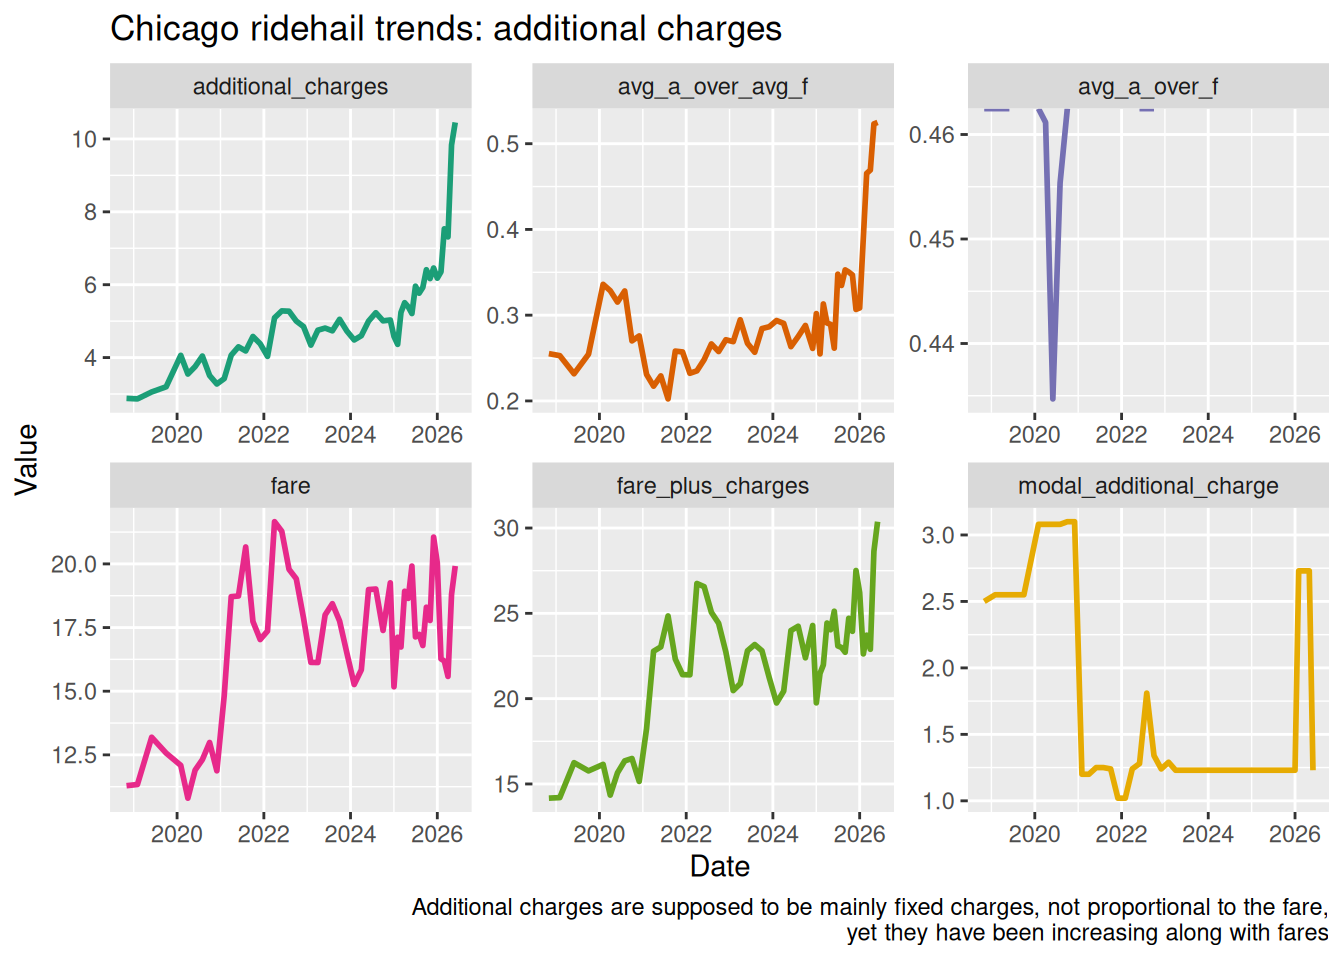
Additional charges
Fares include additional charges (tolls and so on) that are listed separately in the data set. Figure 10 shows how these have changed over time. The “fare” line does not include the additional charges.
One change relevant to “additional charges” is that Chicago introduced congestion zone fees of $1.50 per ride in some parts of the city, starting in January 6, 2026. However, this seems insufficient to explain the increase. There have also been reports of overcharging by the platforms. Any suggestions, please email me.