Introduction
This set of charts uses the Chicago Trips data set to check monthly trends. To make the analysis more tractable, it uses a 1-in-16 random sample of trips – every trip whose ID begins with a given hex digit – drawn from every day of the month. Trip IDs are hash digests, so the sample is unbiased, and covering every day means it carries the real day-of-week pattern. Averages and shares are read straight off the sample; trip counts are scaled back up by the measured sampling ratio.
Trips per driver
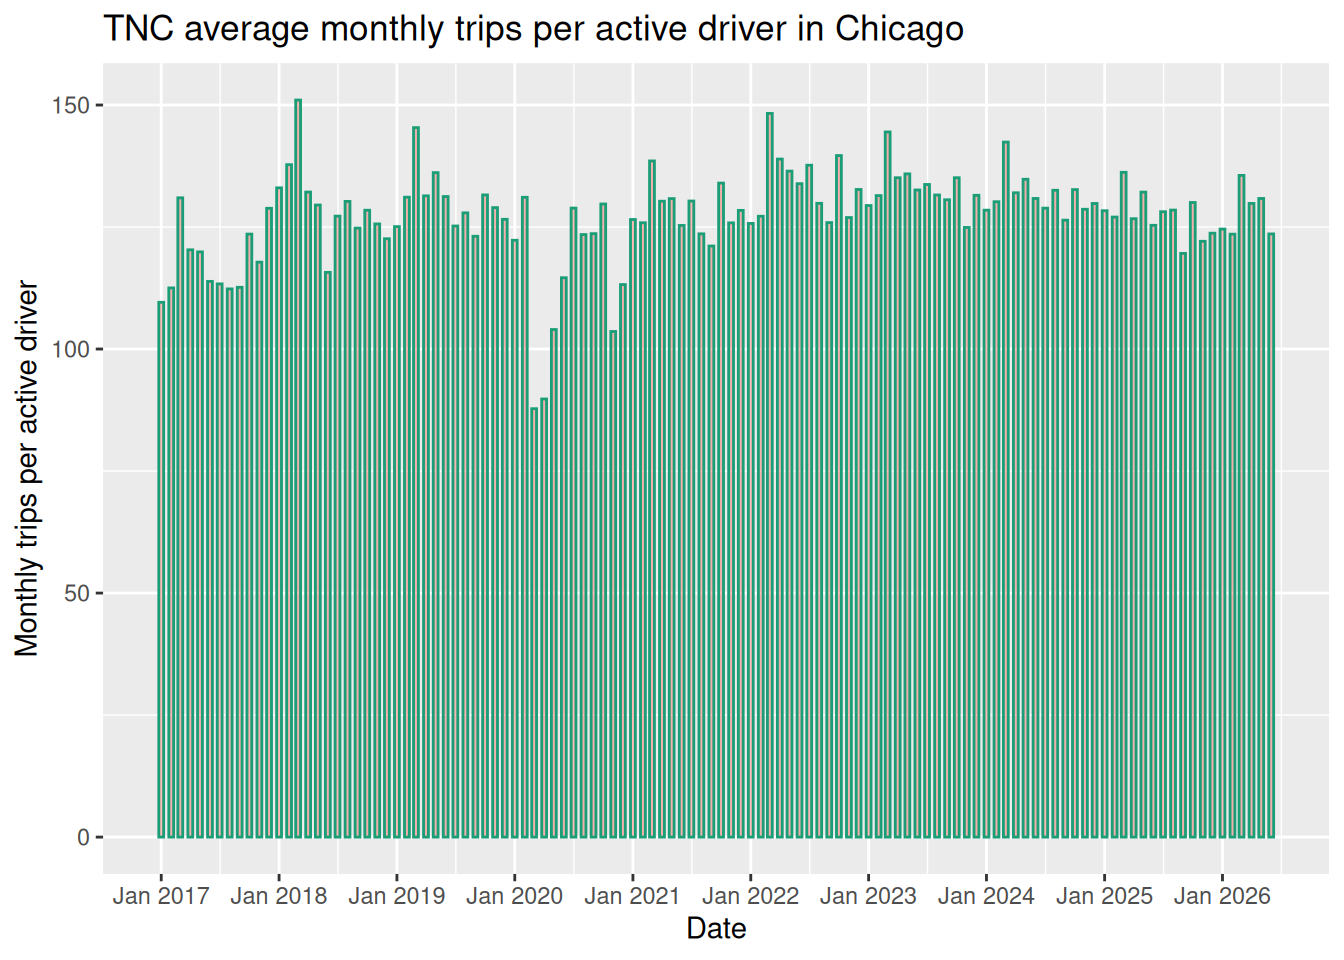
Figure 1 shows the average (mean) number of monthly trips per active driver in Chicago, which has stayed consistent at 125 to 150 trips per month, over a long period, with the major deviation being the Covid collapse. A more detailed picture of driver activity is given below.
Drivers, by trips driven
There is no one Uber driver. To understand how Uber operates, it helps to know what the range of driver participation is. Some drive only occasionally, some drive full time.
Figure 2 shows driver activity by number of trips per driver. Most drivers give only a few trips, but there are a small number of drivers who give many trips.
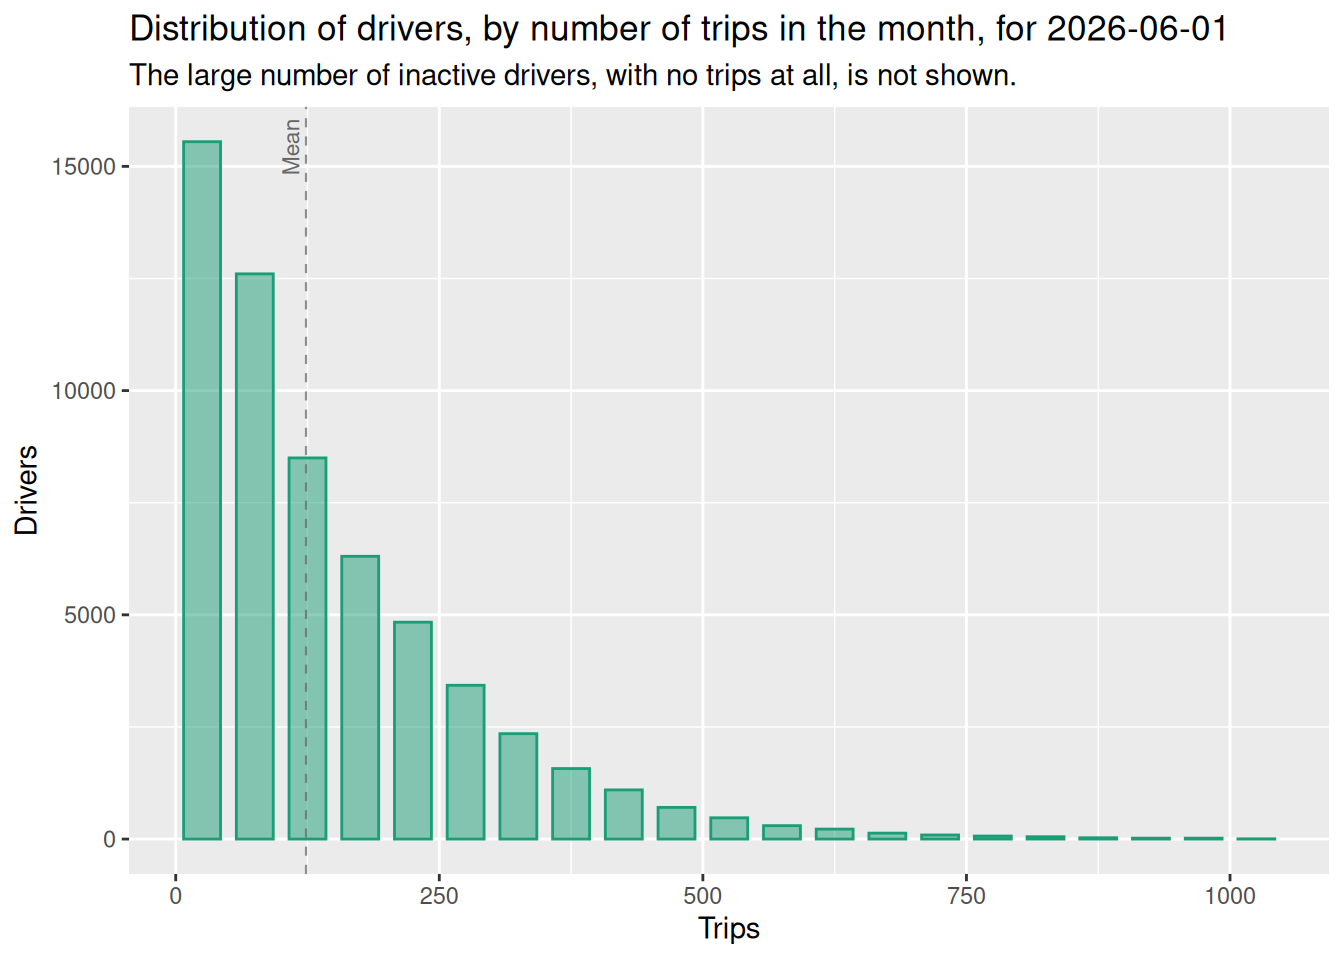
For July 2026, of the 86,308 total drivers, 27,080 (31.4%) took no trips at all, leaving 59,228 (68.6%) active drivers.
Categorizing drivers
To look at driver activity in more detail, it helps to categorize drivers as “full-time” or “part-time”. The line dividing the two is inevitably artificial, but it still helps to make sense of the driver population.
The Chicago data set does not provide driver times on the platform. The nearest we get is the number of trips in the month.
Using an average of 20 minutes per trip (from the Trips data set) and a utilization rate of 66% (a generous estimate from Fehr & Peers) gives two trips per hour. A 30 hour week translates into 60 trips, which is about 250 trips per month.
Any attempt to divide the distribution into categories is a bit arbitrary, but this section shows a few categorization schemes.
Seattle classification
The Seattle classification of Hyman et al to map that onto the Chicago data. The categories are:
| Category | Trips | Estimated hours / week |
|---|---|---|
| 1 | < 40 | < 5 |
| 2 | 41 – 160 | 5 – 20 |
| 3 | 161 – 240 | 20 – 30 |
| 4 | 241 – 320 | 30 – 40 |
| 5 | > 320 | > 40 |
The proportion of Casual drivers fell off quickly from 2016 to 2018, and the number of part-time (160-240) and full-time drivers rose. Since then, the composition has changed only a little.
Figure 3 uses 250 trips per month to separate full-time and part-time drivers, or about 31 hours per month, to show how the market is divided between the two groups (or ends of the spectrum). It shows that even though full-time drivers make up less than a fifth of all drivers, they are responsible for about half of all trips. The statistics have remained remarkably constant over time.
Full-timers and part-timers are both essential to Uber and Lyft’s ability to deliver the volume of trips they handle. But these two groups do not always share the same interests.
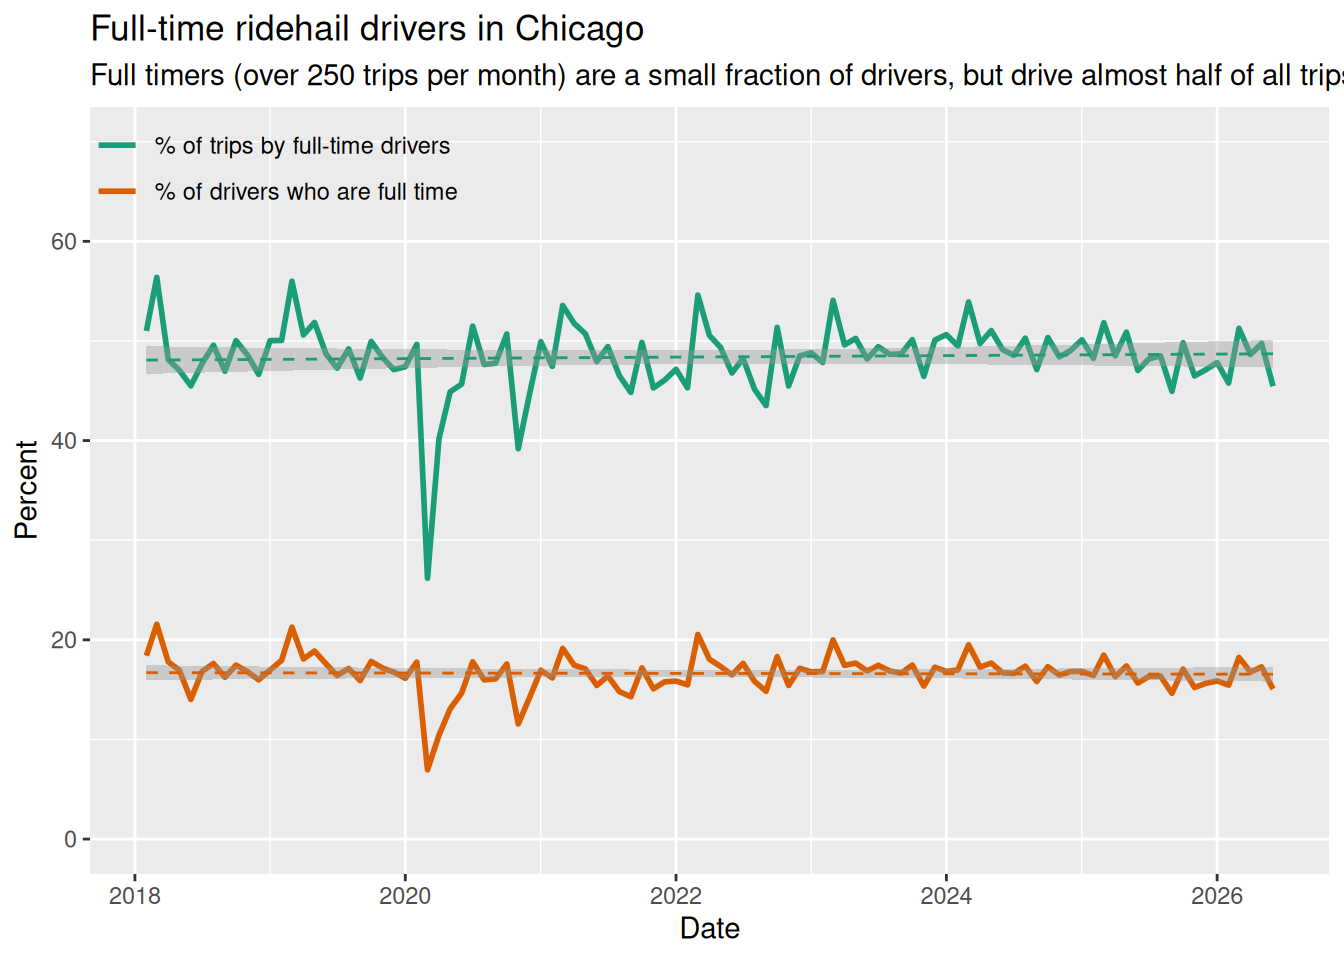
Here are the values for the most recent month:
| Measure | Value |
|---|---|
| % of drivers who are full time | 16.1% |
| % of trips by full-time drivers | 47.6% |
Mean and median number of trips per driver
Although there is no “one type of Uber driver”, averages may still be useful to track trends.
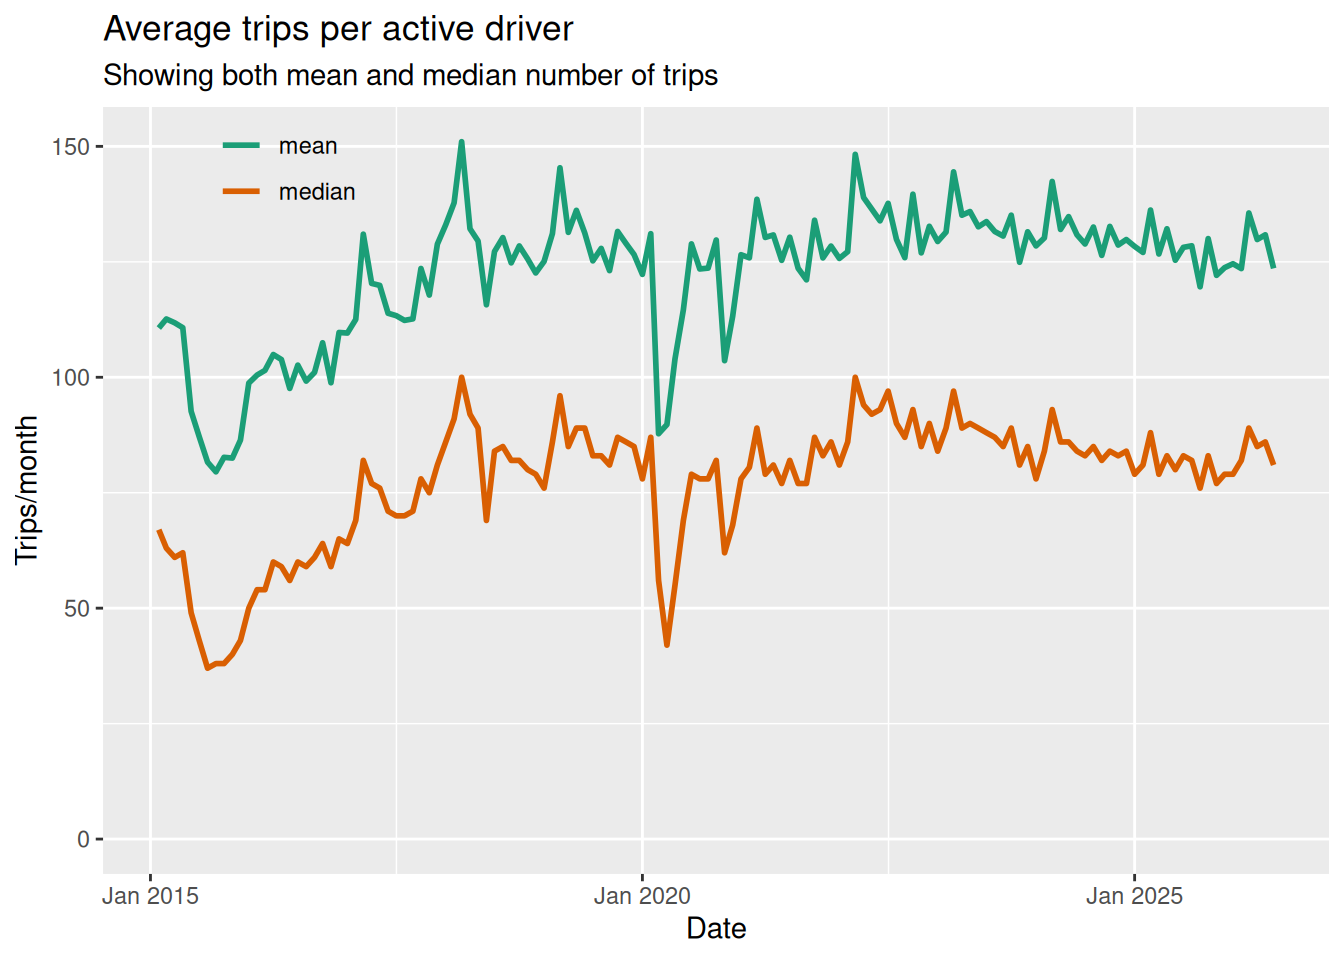
?@fig-trips-per-driver-sql shows both the mean and median trips per active driver. The mean (which we showed above) is the total number of trips divided by the total number of drivers. The median is the number of trips for a “typical driver”, in the middle of the driver population.
Both the mean and median trips per month have been consistent for some time, showing that the basic nature of the driver population has been roughly unchanged for several years.