State: working draft.
Reader highlights and annotations enabled through hypothes.is - see the floating annotation sidebar at the top right.
The City of Chicago collects data from ridehail platforms and makes it available as open data. The data cover all transportation network company or “TNC” trips, but the TNC market is mainly Uber, so that’s what I am going to call it.
Each month, Chicago publishes data on drivers and on trips. Unfortunately, there is no data on utilization rates, but this is enough to tell us quite a bit about the state of the ridehail market. No individual drivers are identified.
The data for December 2022 was just released a couple of days ago. Let’s take a look.
1 The ridehail market has not recovered from Covid
Despite what the company says, the Uber ridehail market has not recovered from the effects of the pandemic.
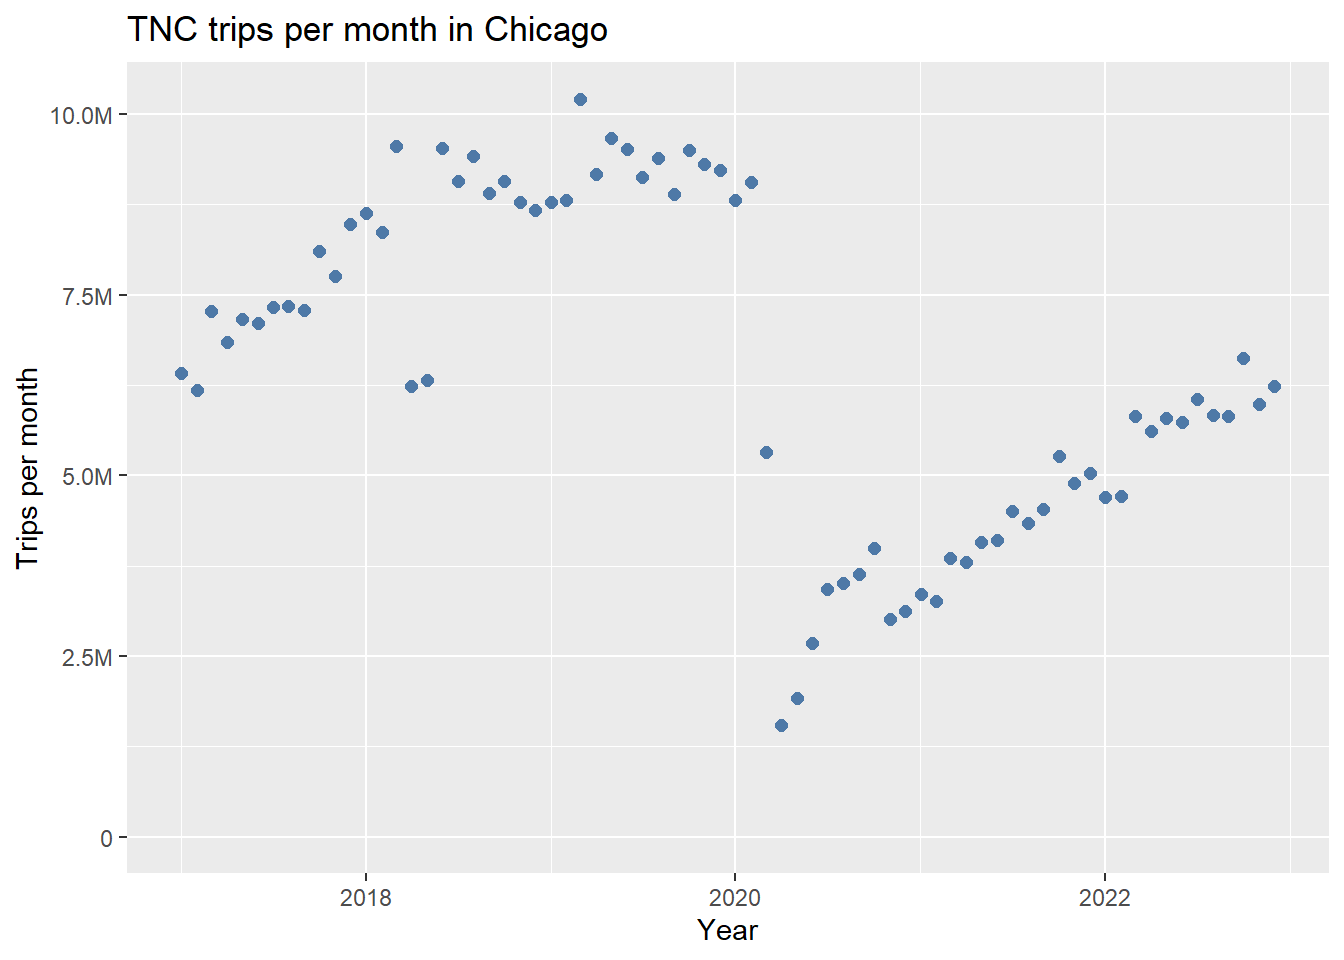
1.1 Trips are at about two-thirds of pre-Covid volume
The number of trips, which grew to almost 10 million per month in 2018 and then levelled off, was unsurprisingly hammered by Covid in February and then March of 2020. Since then it has been picking up, but it is still only about 2/3 of its pre-pandemic volume, and while the trip volume is still increasing it has a long way to go if it is ever to reach those numbers.
1.2 Active drivers are also at about two-thirds of pre-Covid numbers
The number of active drivers (that is, drivers taking at least one trip in a month) follows a similar trend (see Figure 2): rising to a high of about 70,000 in 2018 and 2019, plateauing, plummeting to below 20,000 in March 2020, and climbing back slowly to around 50,000 today. Again, there is a long way to go if the driver population is to recover to previous numbers.

So when Uber CEO Dara Khosrowshaki, in August 2022, says that “more people are earning on Uber today than before the pandemic”, it’s easy to think that there are more Uber ridehail drivers than before, but city-on-city that’s not the case.
1.3 Loss of rush-hour trips is a big contributor
Figure 3 shows the number of trips each hour during the day, for February 6 of each year. (I chose February 6 to match a report from the City of Toronto (Policy & Innovation Transportation Services 2021)). The overall drop in trip volume is clear, as is the particular drop around the peak commuter hours of 8-10am and 4-7pm. This is no surprise: in many big cities commuter traffic at rush hour has not recovered. The December 2022 data is not that different in this respect. I’ll look for this year’s February 6 data when the City of Chicago releases it, probably at the end of March.

In short: the ridehail market was hit hard by the pandemic and, like many other aspects of city centre working life, has not recovered.
2 The diverse driver population
Much of the talk (and research!) about Uber drivers ends up providing “typical” wages or other average numbers. But the diversity of the driver population cannot be ignored. Instead of treating Uber drivers as one big homogeneous lump, we can at least split them into two (representing the poles of experience).
2.1 Full-time drivers provide about 40% of all trips
Figure 4 shows the number of trips for each active driver, in December 2022.

From Chicago trip data, the average trip duration is just under 20 minutes. There’s no information provided on how much of each hour a driver is engaged with a passenger and how much is “dead-heading”, but in other cities it’s between 50% and 60% of the time, so on average a driver can undertake about two trips per hour. If we think of a 32 hour work week as the dividing line for “full-time” work, then we can say that full-time drivers are those who take 275 trips or more in a month.
Figure 5 shows that those full-time drivers make up a small proportion of Uber drivers in Chicago – only about one in eight is full-time – but those drivers are responsible for 40% of all trips. In addition, these full-time drivers are more likely to drive in off-peak hours: without them, Uber could not provide a reliable, round-the-clock service.

In reports on Uber driver earnings, one of the big questions is how to evaluate driver costs. Gas, tolls, per-kilometre wear-and-tear and cleaning are common to all drivers, but should we include the other costs of car ownership? And what about insurance? There’s a case to be made that casual drivers who already own a car for personal use would have to pay these costs anyway, so they should not count towards cost of work (for example, Hyman et al. (2020)). But at least for full-time drivers, many of whom buy or lease a vehicle specifically for their gig work, these costs must be considered. That’s how we came up with our figure of $8 per hour for full-time driver income in Toronto in our recent report (Slee 2023), which was written up in the Globe and Mail last week (Subramaniam 2023).
There are more sophisticated ways to slice up a distribution like this, but moving to “part-time” and “full-time” is a big step beyond treating all Uber drivers the same, and I do hope the debate at least takes on that one level of complexity.
2.2 Many drivers are new
Another way to profile drivers is by how long they have been on the platform. The Chicago data lists the first month on the platform for each driver active in a given month, and that is enough to get a profile. The figures below show a few different perspectives, but the overall message is that driver churn on Uber remains large. A common response to any publication of low incomes is that drivers wouldn’t be doing the job if that’s all they earned (no one makes you drive for Uber) – but these numbers show that most drivers do, in fact, leave after a short time. The Uber driver market is not full of happy drivers.
Figure 6 shows that most Uber drivers are new. The typical driver (yes, contradicting what I said above) has been on the platform for only 7 months, and the average is less than two years.

The numbers have changed over time – in the early days when many drivers tried Uber and dropped it the quit rate was even higher – but Figure 7 shows that half of all trips are provided by drivers with less than a year’s experience.

A third way to look at driver churn is through the fraction of drivers still active after a year. Figure 8 shows that only about one in six drivers remains active after a year. (This may seem to contradict the numbers above, but it doesn’t. The proportion of drivers that start in a given month and are still active after a year is different to the proportion of drivers in a given month who have been on the platform for more than a year.)

References
Footnotes
Regarding the outliers in Q2 2018, there is a note on the City of Chicago web site:
↩︎[S]ome vehicle records for Q2 2018 (April-June) were reported for the quarter as a whole, rather than for individual months. For purposes of this dataset, those records have been assigned to 2018-06 (June). Therefore, some caution in interpreting this month and the quarter as a whole is advised.