Algorithmic “upfront” pricing
Uber just introduced “upfront pricing for drivers” in Ontario, replacing time-and-distance rates with algorithmically-determined pay for each trip. There are questions about upfront prices: Is Uber using personal data to set the rates? Is it just a “rebalancing” as Uber reassuringly puts it?
Chicago is one of the few cities to make ridehail data available. It does not include driver pay, but I thought I’d at least see what it can tell us about passenger fares, and in particular if it has anything to say about “upfront” fares (Uber promotes “upfront” pricing as a transparency move that enables peace of mind: “Before you request a ride, the app shows an estimated upfront price to your destination every time—so you can sit back and enjoy the trip” (Uber, Inc. n.d.). The irony, and why it deserves those quotation marks, is that it simultaneously hides the factors that make up that fare/pay. Point made, I hope, so I’ll stop with the quotation marks now.)
For the charts in this post, I used a data set taken from the Chicago Trips data sets (2018–2022 and 2023–). To get something of a reasonable size for experimenting, I downloaded the data for the first Thursday in the month, for every other month from the beginning of 2019 to August 2024.
So, as the kids say, let’s get going.
Uber increased fares in 2021 and has kept them higher
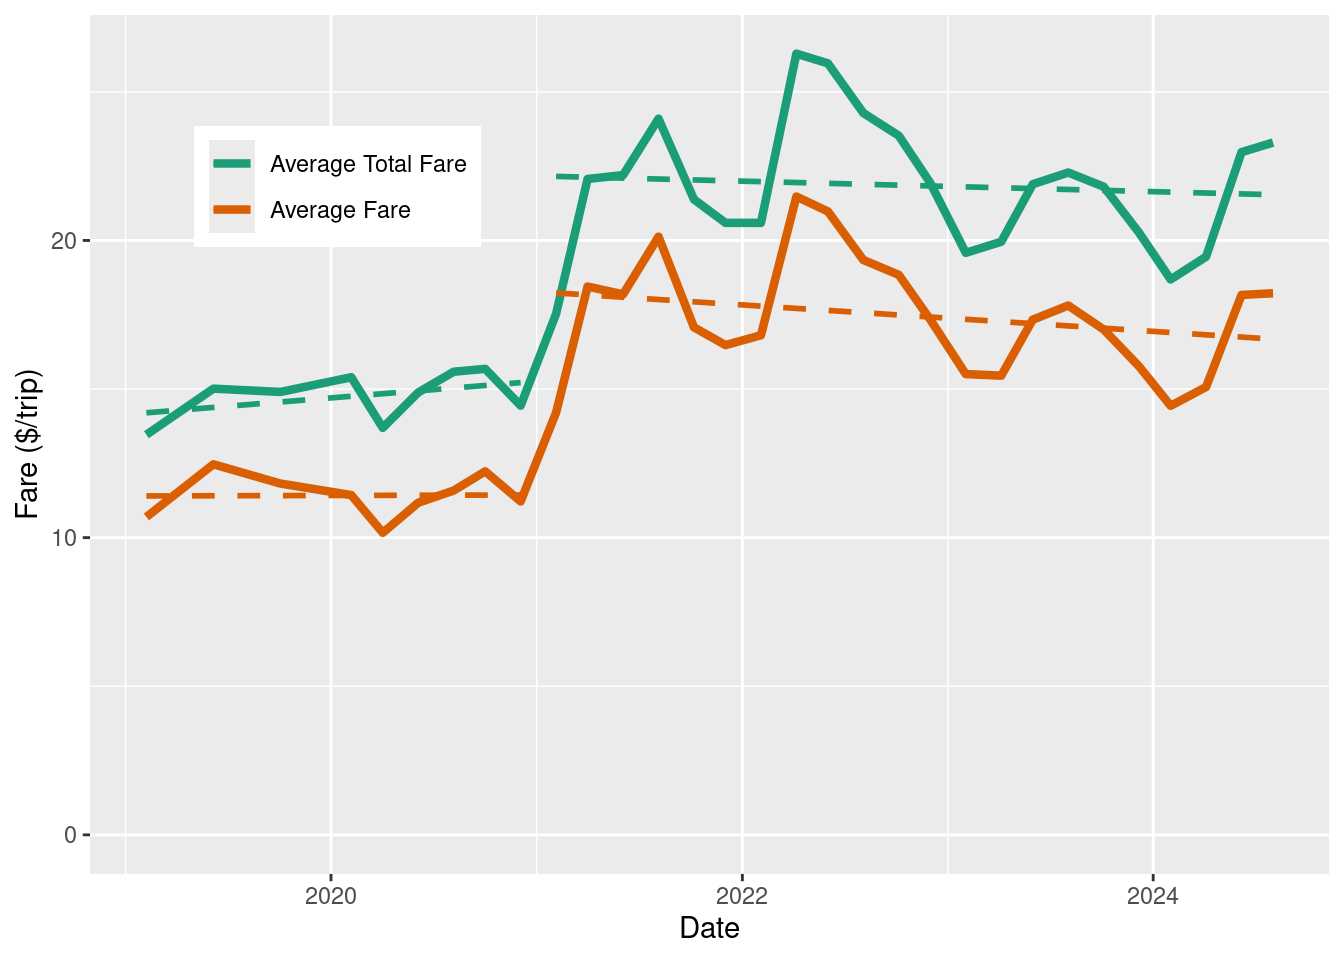
As prologue, here is a check on the overall level of fares over time. Figure 1 shows the average fare for a trip, with (“Total Fare”) and without additional charges such as the booking fee and tolls. Tips are not included. The trend for each is the same, so from here we can look at the fare without additional charges.
The chart shows relatively constant fares from 2019 to the beginning of 2021, with an average of $11.40 per trip, and a 50% higher fare for 2021 onwards, with an average of $17.50 per trip. Even though this observation is based only on Chicago fares, the conclusion that Uber has increased fares overall is consistent with that described by (Sherman 2023) and (Horan 2023).
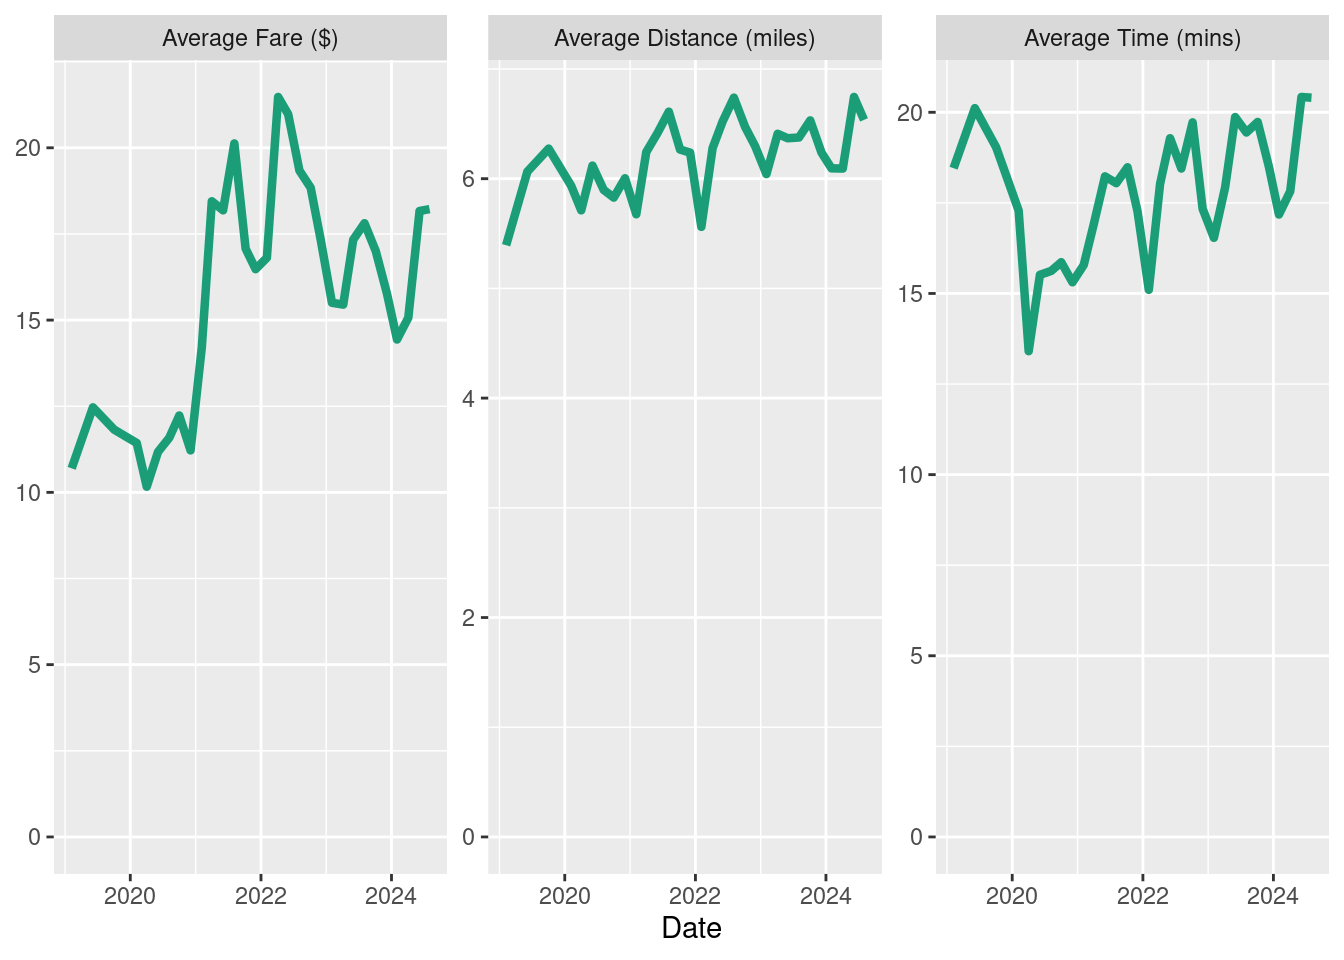
As a check, Figure 2 shows that the 50% fare increase is not an artifact caused by longer trips, whether measured in distance or time. The average distance from 2021 onwards is a modest 7% higher than before, increasing from 5.9 to 6.3 miles (I would guess the small increase is a pandemic-induced fall-off in the number of short and slow downtown rush-hour trips.) Likewise, the average trip duration increased by only 9%. It’s true that gas prices have increased by $1.50 per gallon in the Chicago area since 2020, and gas prices can cut significantly into drivers’ net earnings, but the contribution to a typical 6-mile trip would be measured in cents rather than dollars. So I think it’s reasonable to say that this change is mainly a price hike by Uber.
Uber moves away from time-and-distance rates. So what?
Let’s start to look at algorithmic upfront fares. In its early years, Uber set its fares based on a combination of time and distance. For example, a 6 mile, 18 minute trip with base rates of $1 per mile and $0.20 per minute would cost $6 + $3.60 = $9.60. More recently, Uber moved away from this time-and-distance model and adopted upfront fares. The price for a trip is given upfront, but the factors that set the price are hidden. Upfront pricing is not an all-or-nothing system: the inputs to the model and their importance may change over time as Uber refines and revises its pricing algorithms.
The charts here show only the fares paid by riders. Unfortunately, Chicago data does not include driver income so we cannot see directly how upfront pricing for riders affected driver income, or directly see impact of “upfront pricing for drivers”, a separate initiative introduced to American cities including Chicago in September 2022 (Uber, Inc. 2022).
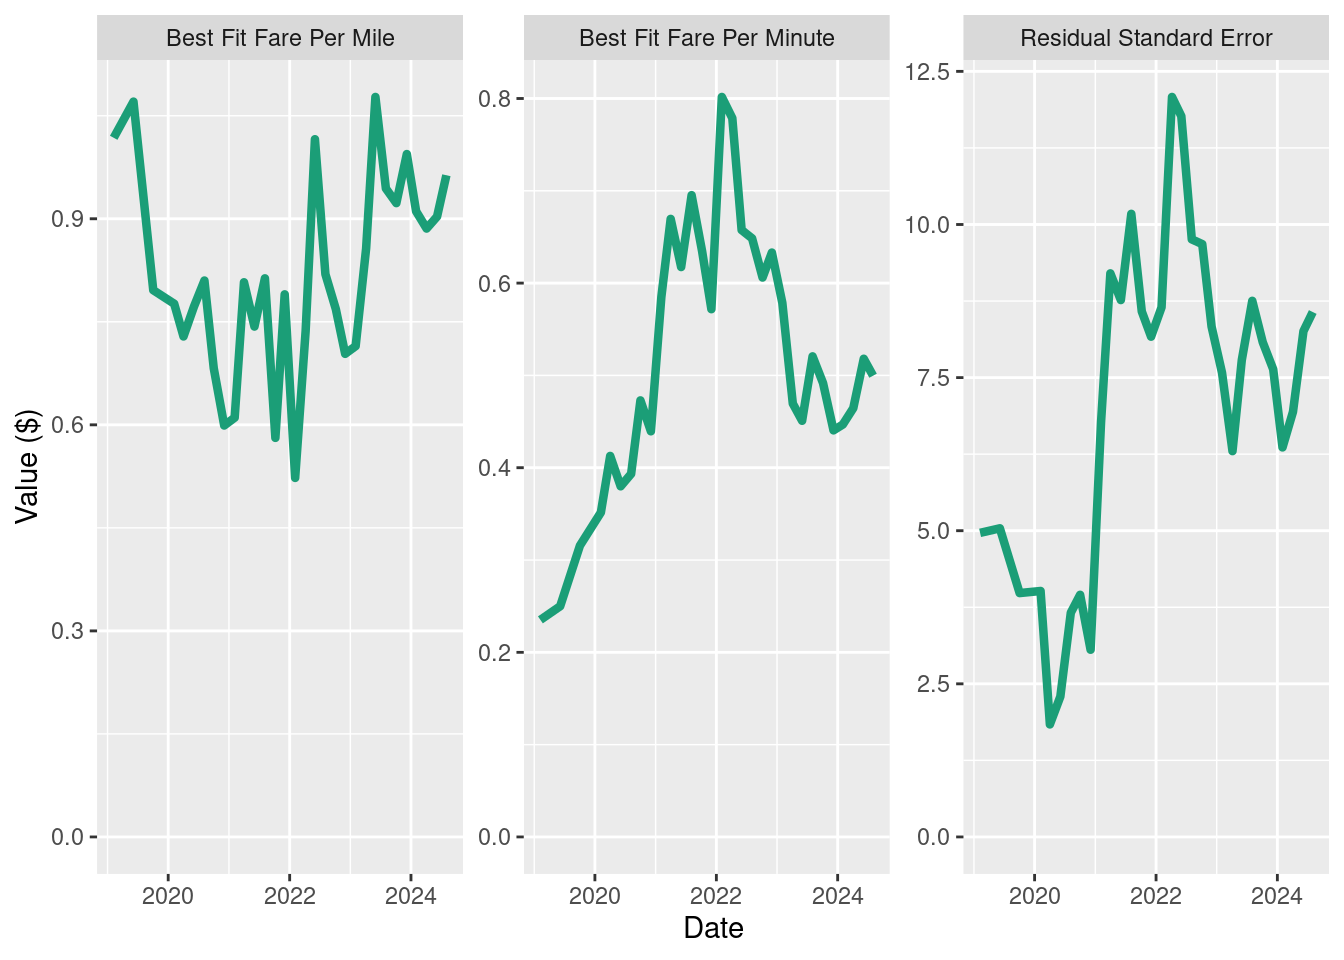
For each recorded month of fares, I calculated the best-fit time-and-distance line. The best-fit per-mile and per-minute values for each date are shown in the first two charts of Figure 3. The best-fit values show that the average fare increase has been driven primarily by an increase in the per-minute portion of the fare. This change will increase prices for slow trips (e.g. downtown) relative to fast trips (e.g. highway trips).
Figure 3 also shows the difference between the best-fit fare and the actual fare for each trip (Residual Standard Error). You can think of this as, roughly, “the actual fare is likely to be the best-fit fare, plus or minus anything up to the residual standard error”. The RSE increases from a average pre-2021 value of about $3.60 per trip to a post-January-2021 average of $8.50 per trip.
This “RSE” is a measure of how much Uber has moved the price away from the time-and-distance baseline. Regardless of when Uber formally introduced upfront fares (and I cannot find a date for Chicago), the RSE is a measure of how aggressively Uber has implemented its upfront fare strategy. I think this is a new observation: at least, if someone else has looked at deviation from time-and-distance fares I’m not aware of it. The question is, can we learn anything from this? I think we can. In fact, two things.
Algorithmic pricing drove the fare increases
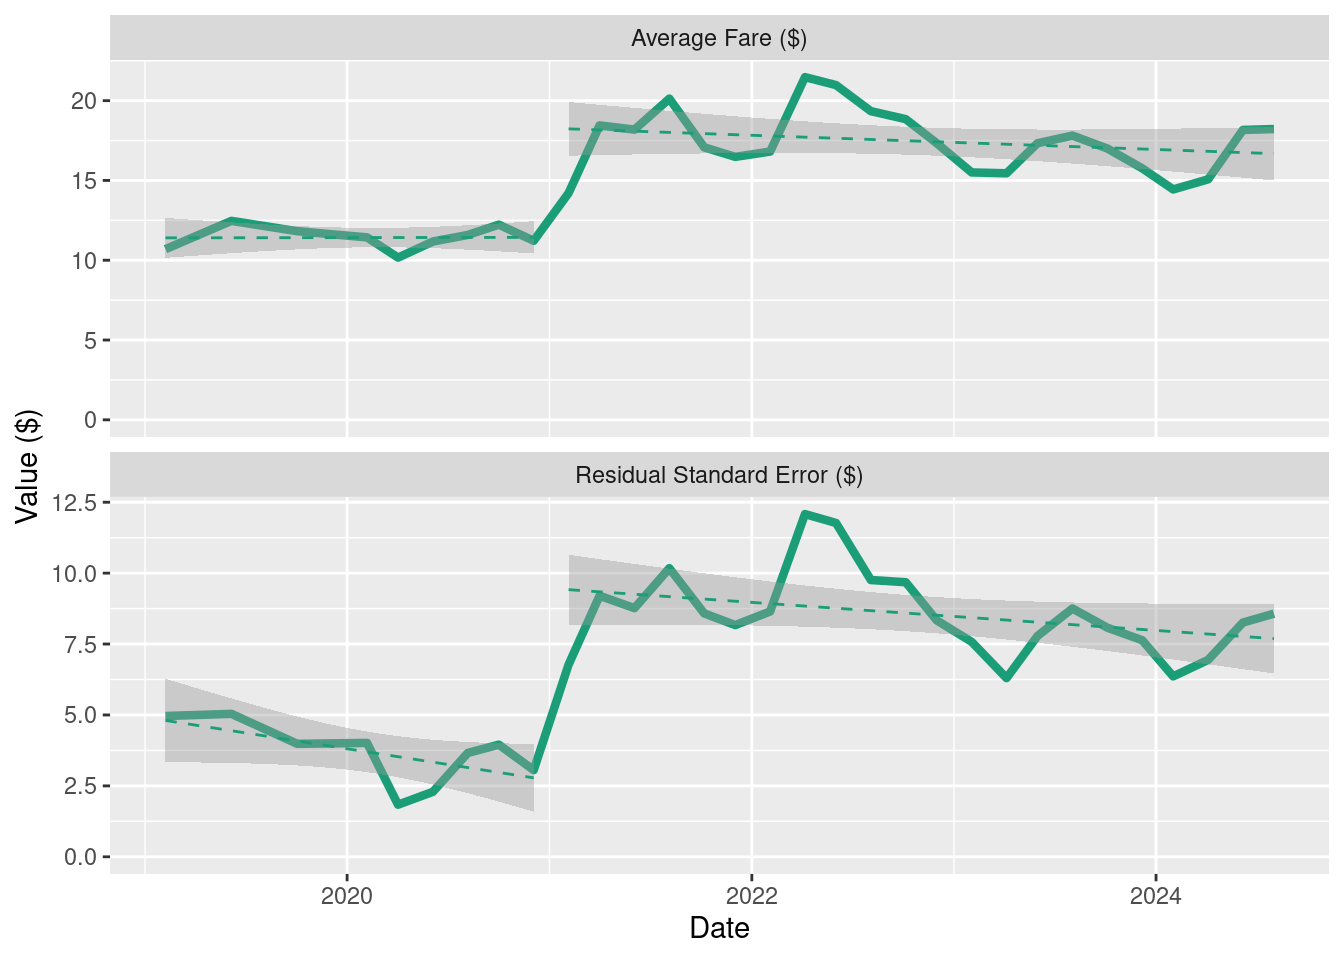
Figure 4 shows that the timing of the increase in RSE matches that of average fares. Best fit lines and error ribbons have been added for 2019–2020 and 2021–2024 time periods.
The increase in RSE marks Uber’s effective implementation of upfront fares: an increased decoupling of fares from a time-and-distance model. Implementation coincides exactly with the increase in average fares, strongly suggesting that the application of upfront fares accompanied the average fare increase. Despite Uber’s “peace of mind” message, these results show that higher prices for riders arrived in tandem with the upfront fare move away from time-and-distance fares.
If Uber is using upfront pricing for riders to increase fares, it is likely that it is also using upfront pricing for drivers to cut driver pay. Drivers in the USA have already claimed that their earnings have decreased over time, and analysis of data from third-party sources supports those claims (Sherman 2023). Paying drivers different amounts for the same work amounts to “algorithmic pay discrimination” (Dubal 2023): these results emphasize that it is not just a matter of paying some drivers more than others, it is a way to drive down Uber’s overall commitment to drivers. Now Uber is introducing “upfront fares for drivers” in Canada, there is good reason to fear that it will reduce driver pay.
Algorithmically-targeted surcharges: the case of location
Uber has said that upfront prices depend on factors beyond time and distance. The public data available does not include personal factors, but it does include location data. By comparing the prices for different locations to the best-fit time-and-distance model we can see whether location is being used as a factor. In other words, “are different community areas treated differently?”
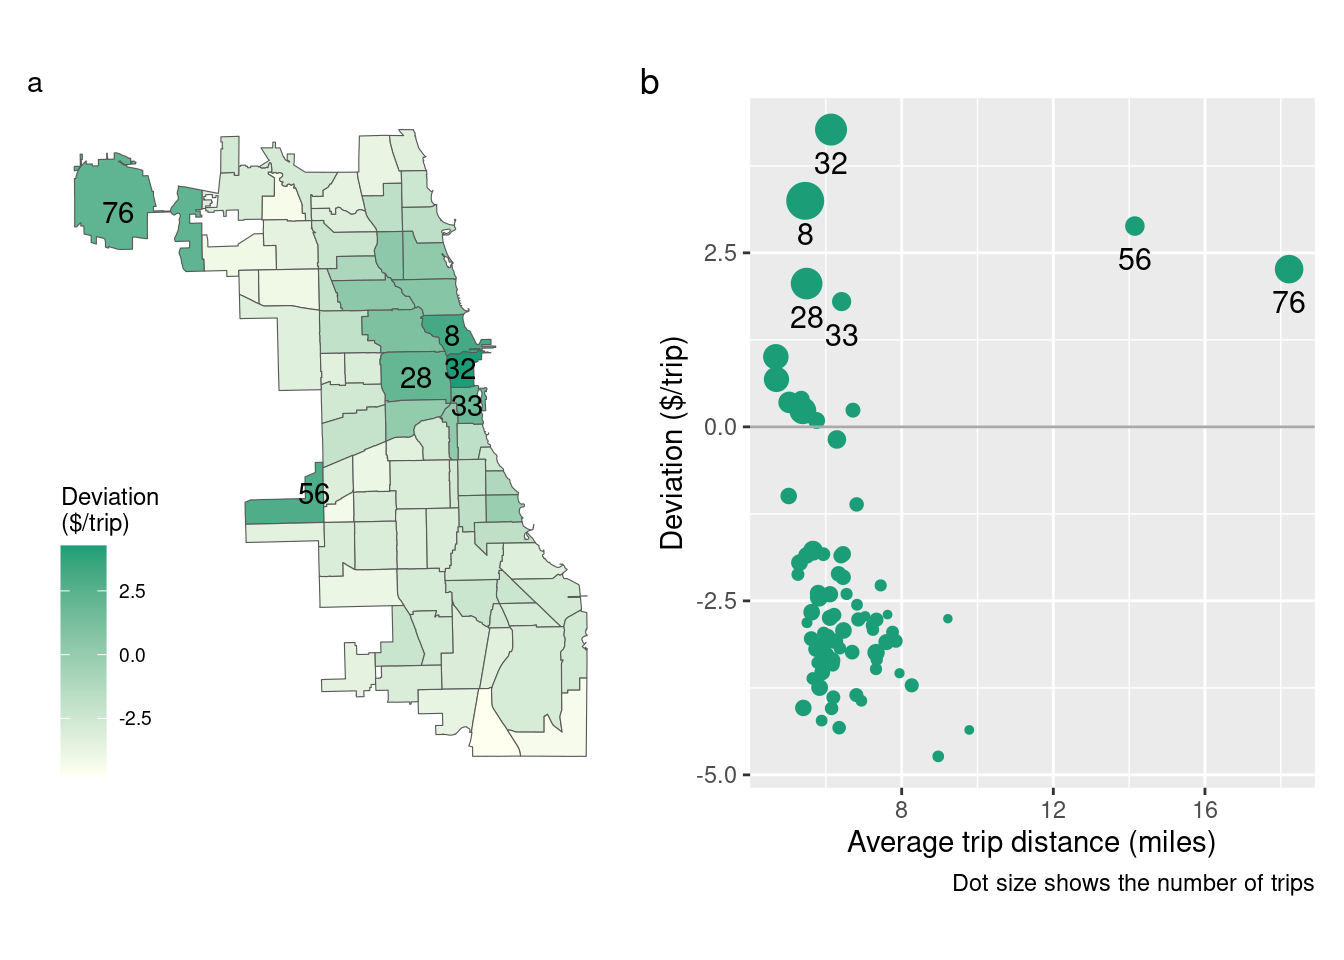
Figure 5 shows that a small number of community areas have trip prices significantly above what would be expected from the time-and-distance model. (Trips are identified by the community area where pickup happens). They fall into two categories:
Central areas (8, 28, 32, 33). These are high-traffic areas (large dots) in central Chicago, where average trip distances are short (to the left of the plot Figure 5 (b)). Because trips are short, Uber has already raised prices here relative to the pre-Upfront “rate card” prices. But in these areas there is an additional price hike: it is essentially a permanent surge pricing for riders in these areas, although unlike surge pricing only Uber knows whether it passes the price increase on to drivers.
Airports (56, 76). Community area 76 is O’Hare airport, and area 56 is the older Midway airport. Trips from here are generally longer than average (to the right of the plot), but are marked up from the time-and-distance model. Again, there is no way to know whether the elevated prices are passed on to drivers.
This is just one way in which Uber is using upfront algorithmic prices to segment the ride-hail market into different, smaller markets where they can test out how high they can set their prices without losing too many riders, and how low they can set pay without losing too many drivers.
Why algorithmic prices matter
While “RSE” may measure the deviation from a time-and-distance model, and although it has accompanied and probably caused an increase in the average fare, RSE is a separate measure to the average best-fit fare. The fare a rider can expect to pay is, roughly, the average fare “plus or minus” the RSE. It is tempting to wonder: if the RSE is independent of the average, and if some riders pay less than the average even as others pay more, does the variability of pricing as measured by the RSE, actually matter in and of itself? The answer is “yes”.
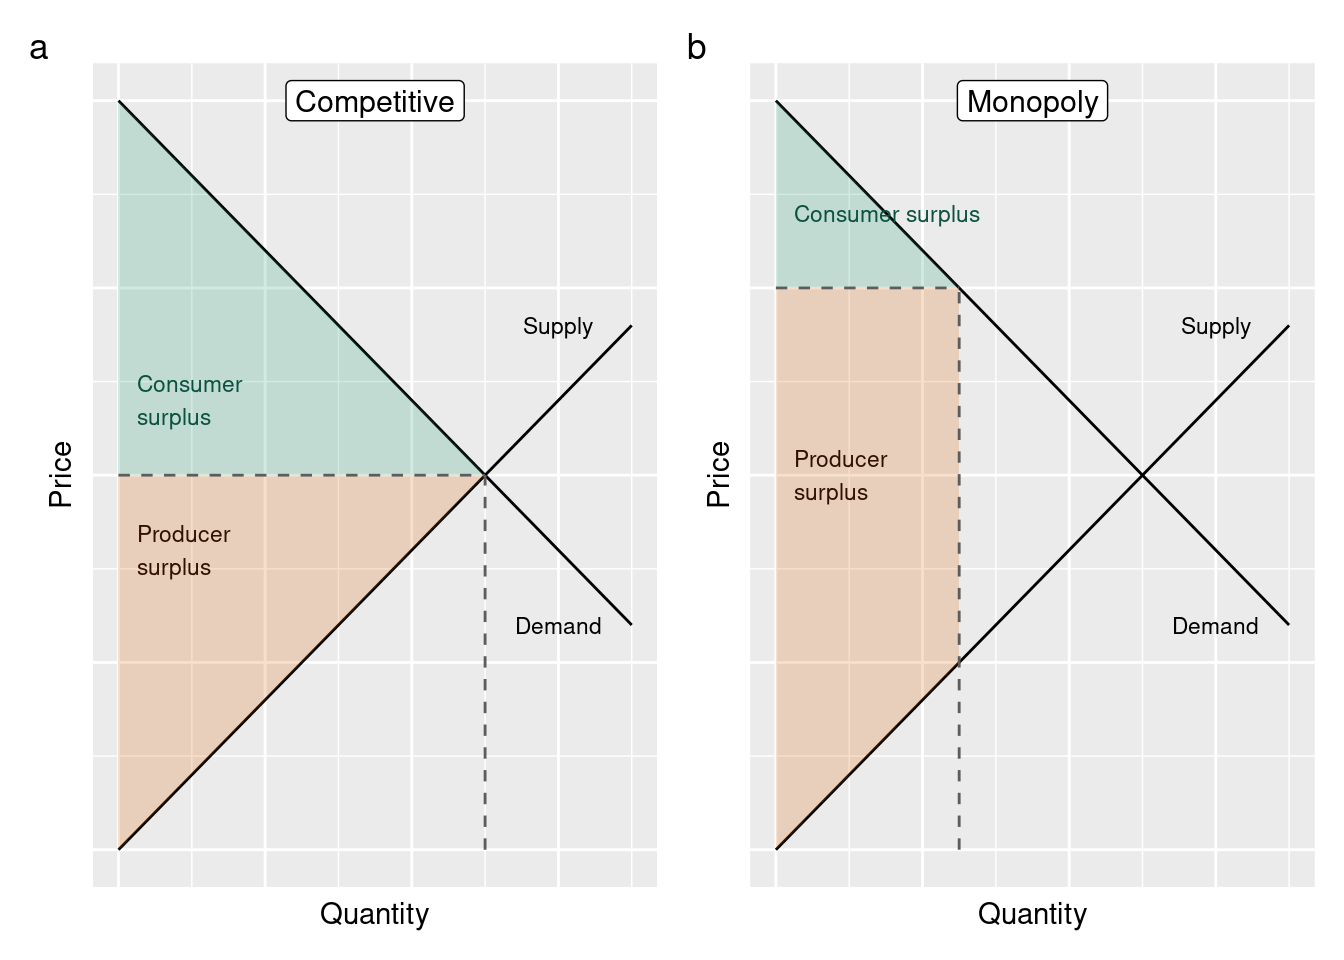
In a competitive market, companies have to lower their prices to meet those of the competition. The ideal result is that prices are lowered so that supply meets demand. Some consumers would be prepared to pay more than this price (the Demand line) and so there is a large “consumer surplus” – the area in red in Figure 6 (a).
In the absence of competition, a monopolist can set its own prices. The result is shown in Figure 6 (b). A monopolist may lose a few customers who are not able or prepared to pay the higher price, but the extra money it gains from the higher prices the remaining consumers pay makes it worth the monopolist’s while. Meanwhile, the consumer surplus shrinks. Competition law exists, in part, to protect consumers from this kind of monopoly behaviour.
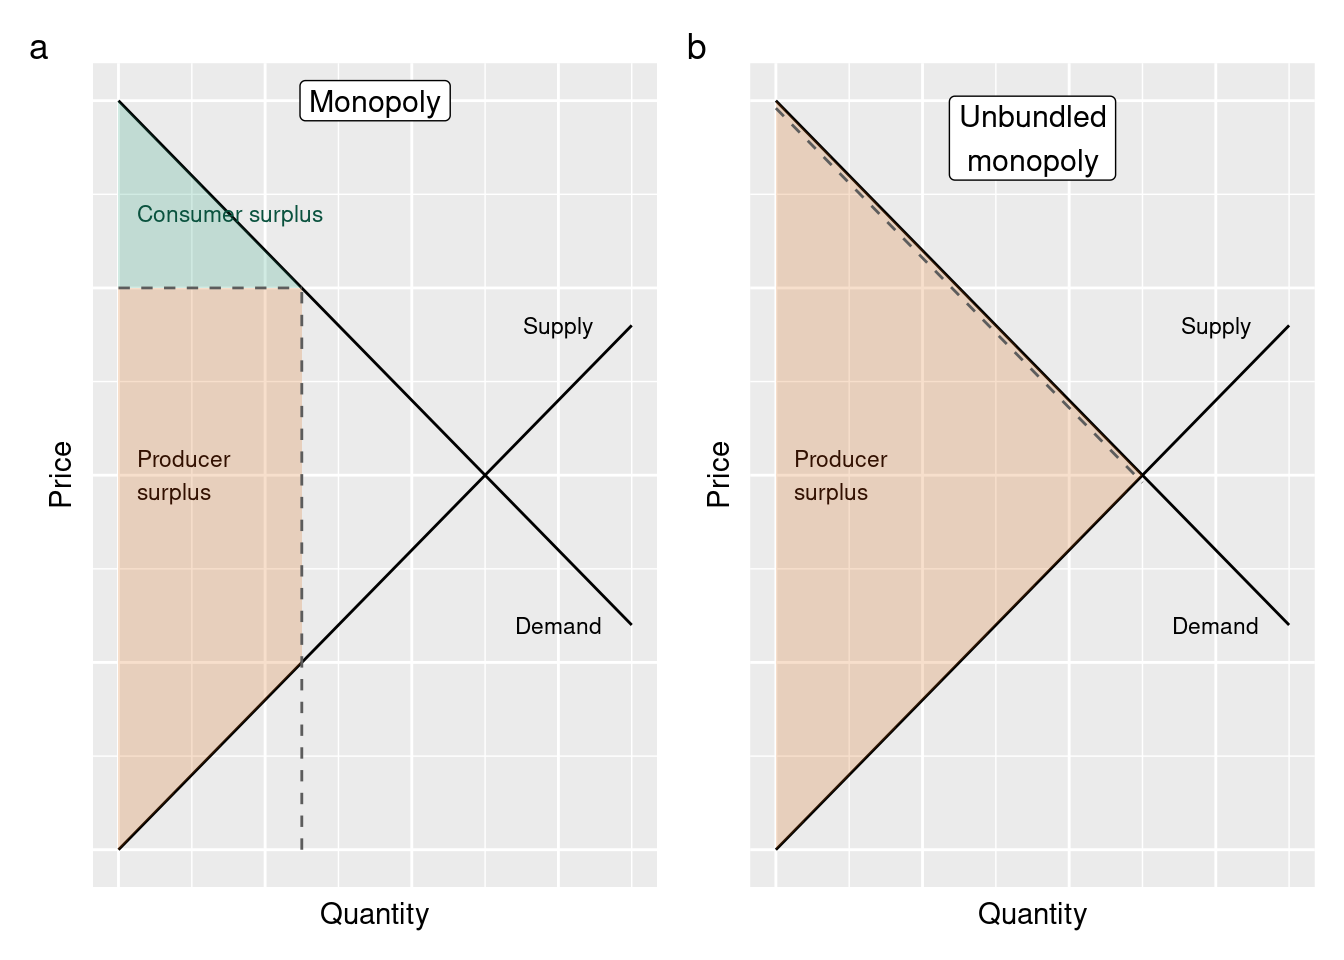
Uber and other platform companies look to go beyond what normal monopolists can do, as shown in Figure 7 (b). By fine-tuning prices for each trip, they can make the most out of each transaction: set a high price for those trips where the rider is prepared to pay, and set a lower price to keep those who would not be prepared to pay the higher average fare. By simply presenting the price “upfront”, consumers do not know where they have been placed on this range.
Conclusions
Uber’s adoption of upfront fares for riders in Chicago increased the average fare for riders. Despite Uber’s presentation of upfront fares as delivering “peace of mind” and “predictability”, they have been used to charge consumers more, to Uber’s own benefit. Uber’s ability to raise prices is typical of monopolists within a market.
The ability to fine-tune prices in a trip-by-trip manner shows that Uber has not only displayed monopolistic price-setting behaviour, but has increased its revenue from each transaction beyond what “normal” monopolists can take. This is a reason for the Competition Bureau to investigate Uber’s pricing activities.
While Chicago data tells us only about “upfront pricing for riders”, the results raise a red flag as “upfront pricing for drivers” comes to Canada. Will this algorithmic payment be used to cut driver pay, as “upfront pricing for riders” has been used to increase rider fares? Reports of driver earnings cuts in American cities where upfront pay has been introduced suggest it already has been.
References
Dubal, Veena. 2023. “On Algorithmic Wage Discrimination.” Columbia Law Review 123 (7): 1929–92.
Horan, Hubert. 2023. “Can Uber Ever Deliver? Part Thirty-Three: Uber Isn’t Really Profitable Yet But Is Getting Closer; The Antitrust Case Against Uber.” Naked Capitalism.
Sherman, Len. 2023. “Uber’s CEO Hides Driver Pay Cuts To Boost Profits.” Forbes, December.
Uber, Inc. 2022. “More Transparency with Upfront Fares.” Uber Blog. https://www.uber.com/blog/more-transparent-earnings.
———. n.d. “Ride Prices and Rates - How It Works.” https://www.uber.com/ca/en/ride/how-it-works/upfront-pricing/. Accessed October 11, 2024.